Modelling a chase is hard. I was looking for a rule of thumb: a quick calculation that could support the monte-carlo simulation I run. And here it is:
Decimal odds of chasing team winning = 1 + (Required Runs/Expected Runs)^8
Jonas (@cric_analytics)
Jonas gave the example of Australia needing 145 more to win an ODI against England. He thought Australia could on average expect to score 110 from their last 20 overs. Australia’s decimal odds were thus 1+(145/110)^8 = 10.1 (or roughly a 10% chance of winning).
To successfully unpack (or steal!) the formula, the element that needs a bit of thought is “Expected Runs”. We can use Duckworth-Lewis, combined with ground data to give an approximation. 20 overs & 5 wickets left meant 38.6% of resources remaining. On a 285 par pitch, that’s the 110 Expected Runs that Jonas calculated.
Taking the formula one step further, “Expected Runs” can be adjusted for the quality of the batting and bowling teams to give a more precise calculation for a specific run chase. I have added this expanded formula to my model to better understand who is winning and why.
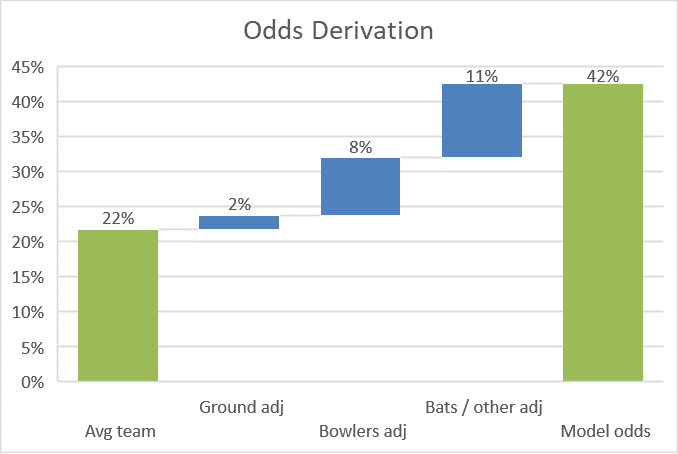
Here’s an example of what this looked like when Australia were 222-5, needing another 81 from the last 10 overs (third ODI, 16th Sept 2020):
Aus 222-5 (40). Maxwell 74* Carey 77*. Target 303.
The raw formula gave Australia a 22% chance with 26.1% of resources remaining (Expected Runs = 69, on the basis that a normal par score is 264 – that may be an underestimate as scores keep rising). However Old Trafford slightly favours the batsmen, and England’s attack is sub par – lifting Australia to 32%.
My model had Australia at a 42% chance – the extra 10% coming from the strength of Australian batting, the two batsmen being set, and any other differences between my model’s Monte Carlo simulation and Jonas’ formula. The right hand column is the output of my model, and the penultimate column is the one that goes haywire if something is wrong: a useful check.
What’s the message? Firstly, if the model is working, I can see who is winning during a chase and why. Secondly, matchups and other complexity have made my model something of a “black box” – Jonas’ formula will be a useful check that my model isn’t off piste.
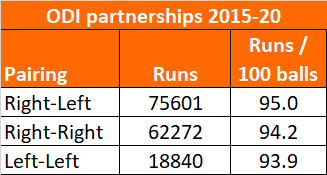
Let’s start with the superficial (Boo! Hiss!) – a right-left pair score 0.8 runs per hundred balls faster than a right-right duo.
ODI partnership summary – min 120 balls, top nine teams only, up to 18 June 2020.
But right-left pairings aren’t something exotic. They are the normal state of affairs. 48% of ODI runs are scored by this combination. No bowler should be phased by normality.
Jarrod Kimber, while concluding that “it’s complicated”, suggested the quicker left-right scoring is a combination of additional wides and ensuring unfavourable spin matchups for the fielding team.
But what about taking into account how quickly players usually score? Gayle, Munro, Morgan are quick scoring left handers, who will be involved in fast scoring partnerships.
I’ve taken each ODI pairing of the last five years and looked at how quickly they should score together – which is the mean of their strike rates. For instance, Sikhar Dhawan (98) and Rohit Sharma (96) would be expected to score 97 runs per hundred balls. Actually, they favoured setting a base, and scored at 86 per hundred balls. No right-left benefit there. However, the Dhawan-Sharma point is anecdotal – the real story is in the general case.
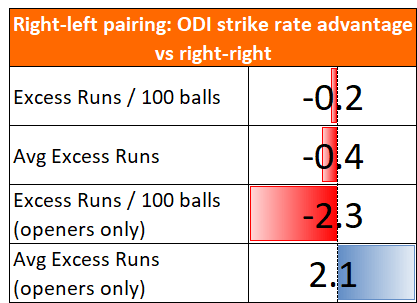
Two ways we can look at this – firstly, excess runs per hundred balls (ie. take all the right-left pairings, compare the runs they scored against expectation based on individual strike rates, and divide by the number of balls bowled). Right-left combinations are weaker than right-right pairs on this metric by 0.2 runs per hundred balls.
Next, because the first method is weighted towards players that batted together lots (Roy-Bairstow’s blitzes have a big impact), we take the raw average of each pairing. For example, Dhawan-Sharma’s impact score is 86 minus 97, being -11 runs per hundred balls. Taking the average for all right-left pairs, they come out 0.4 runs slower per hundred balls than right-right partnerships.
That’s 2-0 to the right-right pairings. Right-left combinations look slower than right-right pairings, once you adjust for who is batting.
But could it be impacted by time of the innings? For instance, do lots of right-left pairs open the batting, so score more slowly at that stage of the innings? Let’s repeat those same two calculations, but just for openers.
Darn it. We have three measures saying right-left pairings are of no benefit, against one saying that they are.
We need more data.
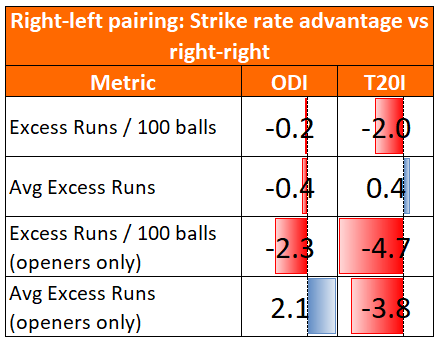
The good news – I’ve finally found a use for all those meaningless T20Is: to test right-left supremacy.
Running the same methodology for 2015-20, it’s nice to see some familiar faces. Dharwan and Sharma top the list, with 1,663 runs together. This time their collective strike rate of 141 is much closer to what we’d expect. And the general case:
Conclusion & Discussion: If anything your team will score faster with two right-handers batting together. Why should that be? One thought: with a left-right combination, the bowler must have a different approach for each batsman, and adopt the optimum lines and lengths for the player on strike. However, with two right handers that isn’t necessary. Is there a risk that a bowler tries to apply the same plan to two quite different right-handed players? I’ve no idea, but it kinda feels possible.
***
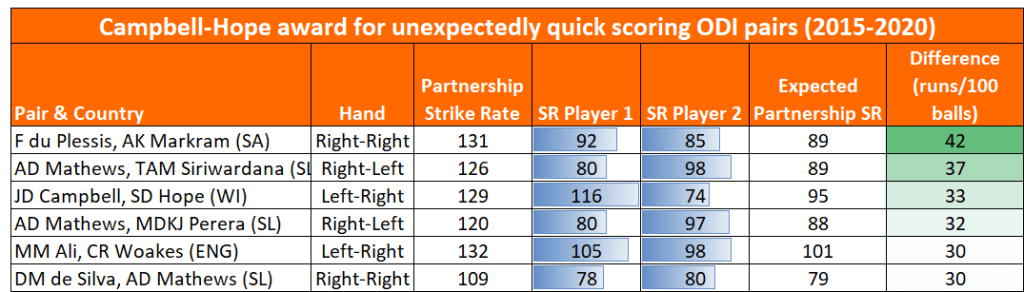
This has all been a bit dry, so let’s have some fun. Firstly, the Campbell-Hope award for the pairings who added up to more than the sum of their parts:
Min 300 runs. Top nine teams only.
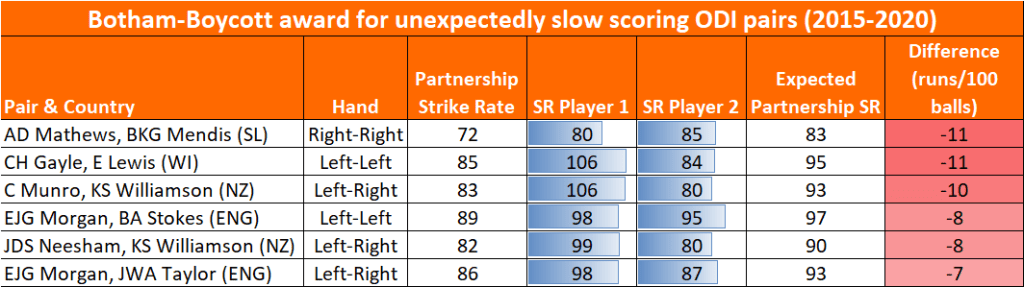
And the same for slow scoring – where two batsmen either don’t gel or happen to have come together to consolidate not dominate:
Min 300 runs. Top nine teams only.
PS. That was supposed to be some harmless trivia. But Angelo had to spoil it. Did you see him in four of the twelve pairings? Another hypothesis to test: “Is Angelo Mathews better with some players than others”?
Further reading – Cricinfo analysis of ODI partnership averages. Concluded no advantage to left-right partnerships. Doesn’t cover strike rates though – so I may have done something original here.
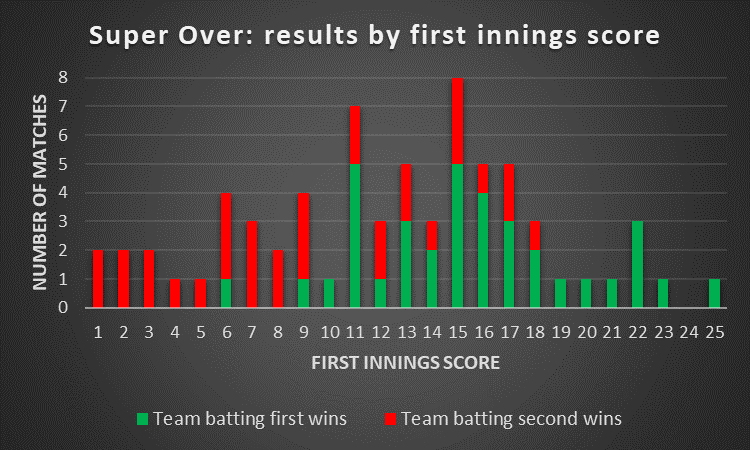
Suggest you read the full article there. In case you don’t fancy clicking, here are the key drivers to Super Over success…
Score at least twelve runs if batting first
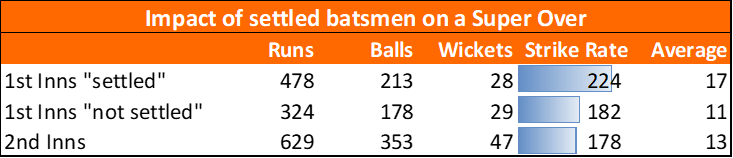
Pick a set batsman if batting first
Don’t let the number three play it safe if batting first
Stay calm when chasing
Pick a bowler to trouble their opening batsmen
Put the best batsman on strike for the first ball
Plan for a second super over
That’s seven factors without even considering lines, lengths, field placings or shot selection. Super Overs might look like a six ball thrashabout – but there are subtle forces at play.
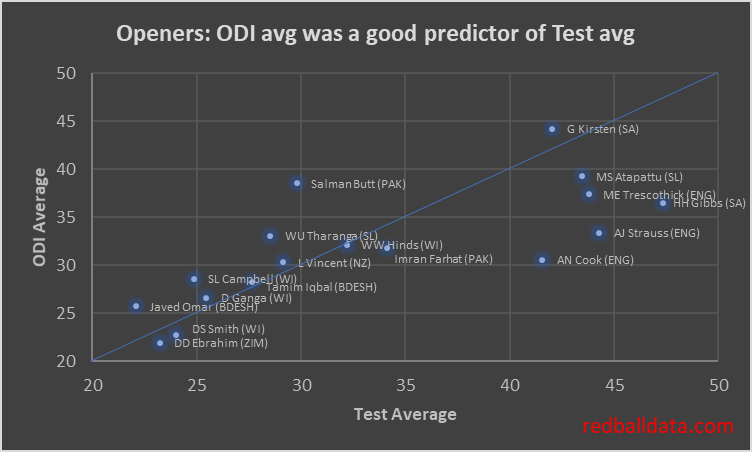
Wind the clock back. The good old days. Specifically the noughties (or 2000s, or whatever). An opening batsman fulfilled the same role in Tests or ODIs. Hence their ODI and Test averages were similar, and you could use one to predict the other with a fair degree of confidence.
Fig 1 – Averages of openers to have played >20 innings in Tests and ODIs from 2000-2009
The correlation is so good that the names get all jumbled up on the straight line running from (20,20) to (50,50). Yes, there’s some Test specialists there (Cook, Strauss) but most of the 23 players that meet the criteria for inclusion behave as expected.
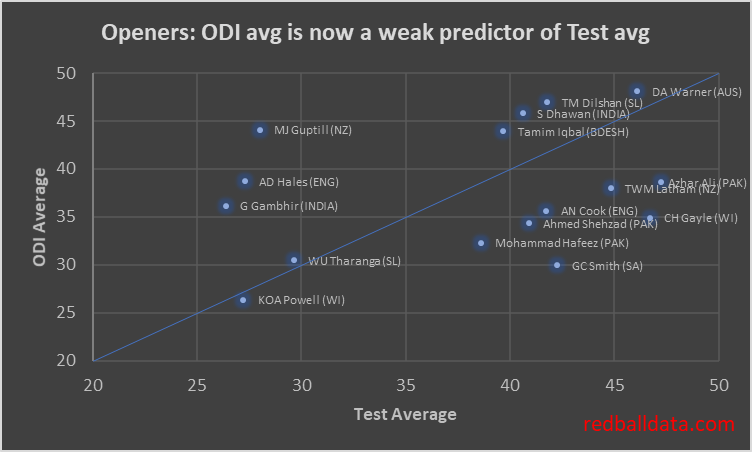
That correlation has broken down now.
Fig 2 – Averages of openers to have played >20 innings in Tests and ODIs from 2012-2019. Note the same axes as Fig 1.
There are three distinct types of player, reflected in the clustering in the chart:
Versatile elite batsmen (Warner, Iqbal) – just as good in either format, average over 40 in both.
Test specialists (Latham, Azhar Ali) – who are/were good enough to play in ODI Cricket, but averaged at least five lower in ODIs
ODI specialists (Hales, Guptill) – averaging under 30 in Tests.
I’m reminded of the film Titanic (1997) explaining the captain’s complacency: “26 years of experience working against him”. That line stuck with me – it’s easy to assume past trends will continue, and that you can use opening the batting in ODIs as a pathway into opening in Tests.
Not any more. Unless the player is good. And I mean really good, the best predictor I can see for successfully opening the batting in Tests is successfully opening the batting in red ball Cricket. Think about Jason Roy – ODI Average 43 as an opener, Test Average 19. I don’t think anyone is now expecting him to average 35 in Tests as an opener. Yet someone must have thought he could, else he wouldn’t have been picked.
redballdata.com – closing the stable door after the horse has bolted!
PS. This piece serves as another reminder to me to continually check that the trends I’ve seen still hold – else one day I could be the mug taking Fig.1 to a meeting, persuading everyone to pick the best ODI openers to open the batting in Tests.
This is a pretty basic three-card-trick, in which I’ll make the case that T20 batting has harmed Test averages.
In summary, batting techniques began to adapt earlier this decade so a T20 strike rate of 130 was low risk, then ODI batting adopted those techniques, and finally Test players became unable to adjust between three formats. It’s just one possibility, and I’m aware that correlation is not the same as causation. Don’t worry, there’s charts behind the opinions!
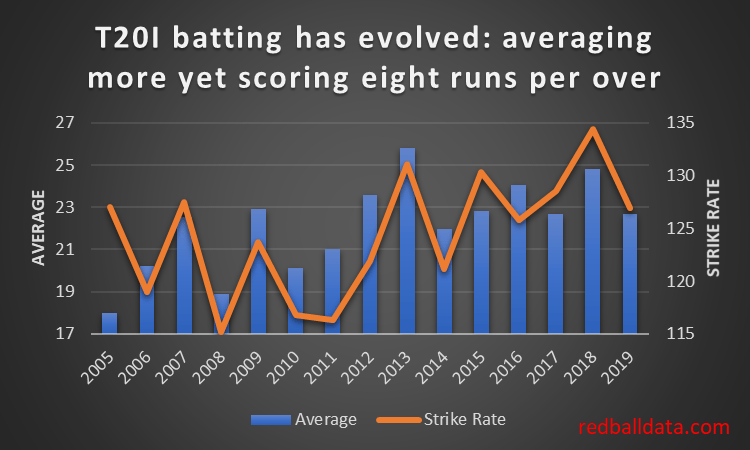
1.Evolution of T20 batting 2011 – 2018
Firstly, high-risk fast-scoring T20 batting has become lower risk. Wisden reckons it’s because teams are getting better value out of the same number of attacking shots (ie. cleaner hitting, not just playing across the line – see Kumar Sangakkara’s description in this video). A precis: “It’s never just wild swings”.
Fig 1 – Runs per wicket and Strike Rate by year in T20 International Cricket. Note how the Strike Rate in 2005 was 127, but batsmen needed to take risks to do it: averaging just 18 runs per Wicket. By 2018 that average was over a third higher.
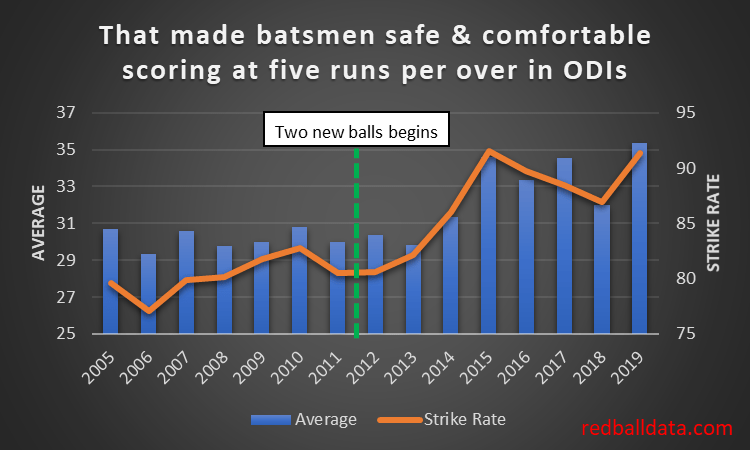
2.ODI batting follows the trend 2015 – 2018
ODI Cricket batting then became more like T20. There’s good reason for this – the optimum strategy for maximizing runs in ODIs became to select T20 players and ask them to score a little more slowly, rather than pick Test players and ask them to score 50% faster.
Fig 2 – Runs per wicket and Strike Rate by year in ODI Cricket (Test teams only). The big jump came after 2014. An aside – there has been focus on how England revolutionised ODI Cricket after their failure at the 2015 World Cup. The above chart shows that that is back-to-front: whatever revolution happened in ODI Cricket happened between 2013 and 2015, then England fixed English one day Cricket.
So far, so good. T20 batting has made ODI’s more interesting. What has it done for Test Cricket?
3.Test Cricket stumbles
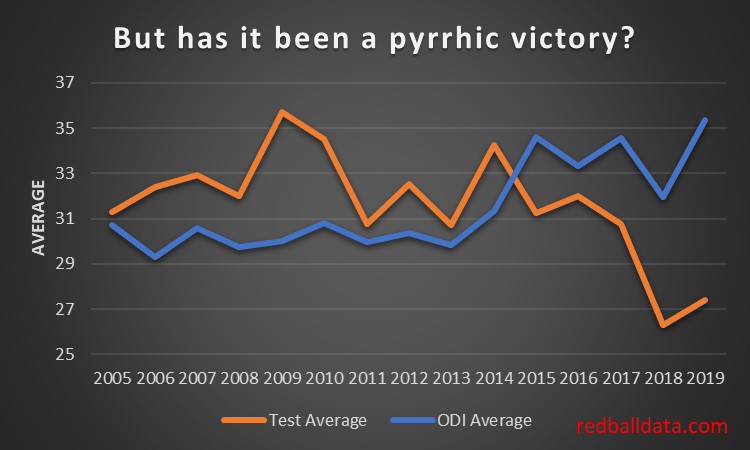
Fig 3 – Evolution of Test and ODI averages since 2005.
Sadly, in all the upheaval, Test Cricket has lost its way.
2015 was the tipping point – it became easier to bat in ODIs than Test Cricket. The real slump has been 2018 & 2019- a paltry 27 runs per wicket.
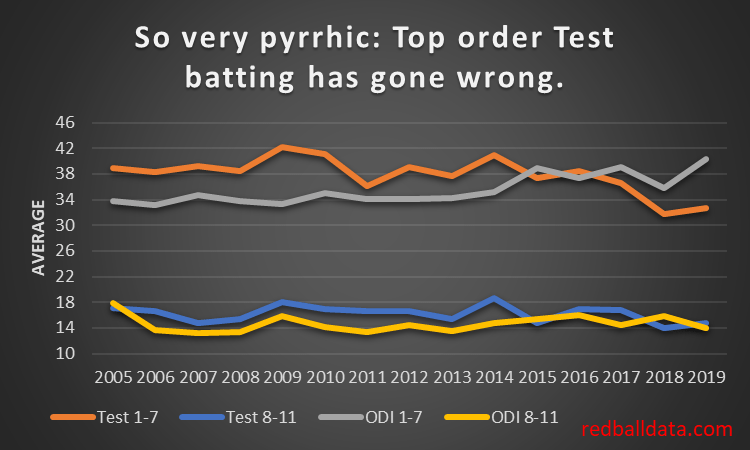
Let’s explore the drivers behind Test batting’s malaise. Firstly, top order batting is the main factor – tail enders are immune:
Fig 4 – Evolution of Test and ODI averages, splitting averages between batsmen 1-7 and 8-11.
Remember the good old days when 38 seemed like a mediocre Test average? That petered out in 2016. Somehow averaging 33 over the last couple of years has been normal. Yuk.
The worst thing? Whatever this disease is, pretty much every team has caught it. Top order Test batting has fallen by the wayside. Test teams are scoring no faster, but averaging less. Hopefully that’s a short term effect caused by the 2019 World Cup. Hopefully.
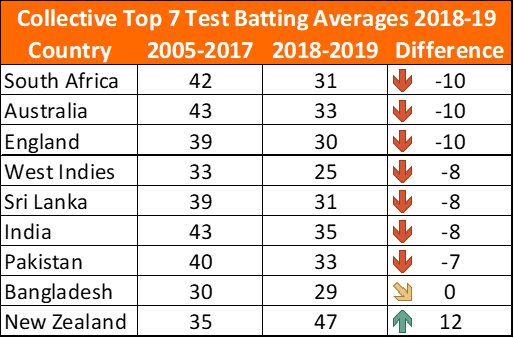
Fig 5 – Top Seven batsmen, collective average 2005-2017 and 2018-19, plus the difference between the two. Congratulations to NZ for improving and an honourable mention to Bangladesh who have gamely stood their ground. Note that all teams played at least 11 Matches over 2018-19, so with over 100 completed innings for each team we have a decent sample.
Now, I’m not an expert on the technical side of batting – so I won’t try to cover it. A couple of examples though: seeing Jason Roy failing to cope with lateral movement in the World Cup final was alarming. Even more so, watching Bairstow shrink from a world class batsman to one that can’t seem to stop walking past the ball when defending.
Where do we go from here? Some Recommendations to turn the tide:
Be willing to separate Test and ODI/T20 batsmen*. Only some will naturally bridge the two squads.
Don’t combine ODIs and Tests in the same tour – these are now different disciplines, give players clear windows devoted to the red and white ball games.
Selectors at First Class and Test level would see benefit from picking ultra-low strike rate batsmen at the top of the innings. There will be white ball specialists in red ball teams (there aren’t enough red ball players to go round) – thus these players need to be protected from the best bowlers and the new ball. For example, County Championship winners Essex had Westley (Strike Rate 48) and Cook (SR 45) soaking up the tough conditions.
*I use the word batsmen deliberately: none of this analysis has included the women’s game, therefore there is no evidence to suggest the same conclusions are appropriate.
Appendix
A query comes from @mareeswj on Twitter – “Are test match bowlers getting better or the batters getting worse“
To assess how bowling has changed in recent years, one needs to look at the same players’ performances in multiple formats over time. Like in astronomy where having stars of known brightness (“standard candles”) reveals other properties of those stars.
Fortunately, there are 15 bowlers that have taken 15 wickets
in ODIs and Tests both up to Dec-2017, and since Jan-2018.
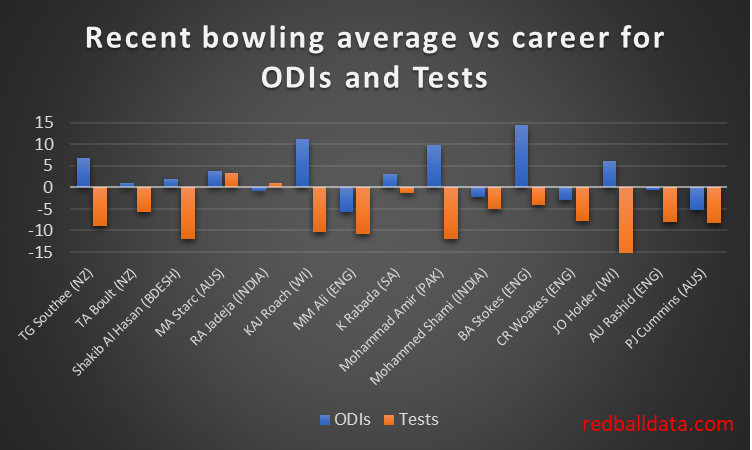
Fig 6 – Comparing All bowlers that have taken: i) 15+ Wickets in Tests up to 31/12/17 ii) 15+ Wickets in ODIs up to 31/12/17 iii) 15+ Wickets in Tests from 1/1/18 to 28/9/19 iv) 15+ Wickets in ODIs from 1/1/18 to 28/9/19
Pretty consistently, they have recently averaged a lot less in Tests (mean reduction in average of 7.6). It’s a slightly more mixed view on ODIs (mean increase in average of 2.8 runs per wicket).
Trying to keep an open mind, what are the possibilities?
Bowlers have focused on red ball cricket
Batsmen have focused on white ball cricket
Pitches are becoming flatter in white ball cricket and spicier in red ball cricket
Ball / umpiring / playing condition changes.
Personally, only #2 feels plausible to me, with the others being secondary effects.
Having a model for ODI Cricket is great when it comes to considering selection, or gambling, but it’s challenging to come up with further practical uses. Fortunately, some recent tweets about batting orders gave me an idea – using the model to suggest the optimum batting order.
England have batsmen with averages and strike rates to get excited about. The current top six is Roy, Bairstow, Root, Morgan, Stokes and Buttler.
Jos Buttler’s career strike rate is 120. He once scored a century in sixty-six balls. If England get a good start, at what point should they push Buttler up the order so he isn’t watching from the pavilion when he could be swishing sixes? He has finished “not out” in 23 of his 116 innings – and could have contributed more in each of those matches if he had been on the field earlier.
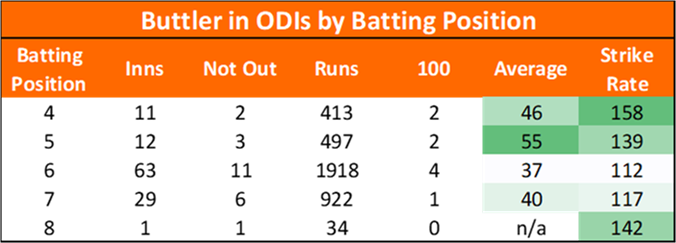
Firstly, let’s consider how Buttler has performed by batting position:
Fig 1 – Buttler’s performances batting in ODI Cricket, up to 13/07/2019 by position in the batting order.
The more excitable among us would conclude that six is Buttler’s weakest position, and he has to bat at four or five based on the above averages and strike rates. Personally (and somewhat arbitrarily), I’d like a 20 innings sample size before concluding. All the table above says is there’s no compelling reason why Buttler can’t bat anywhere in the middle order.
So what number should Buttler bat? Using a model of ODI cricket, simulating England batting against their own bowlers at Chester-le-Street*, we can predict performance for England’s usual batting order and compare that to Buttler jumping up two places to number four.
The Duckworth-Lewis method tells us that the way batsmen play at each stage in the innings is a function of how many wickets have fallen. The hypothesis is that the earlier the second wicket falls, the more conservatively England will bat, and thus the less useful it is to promote Buttler. It would actually be counterproductive, because if he’s out he’s not around to score quickly at the end of the innings.
Scanario time: we join the action at the fall of the second wicket, Roy and Bairstow the men out.
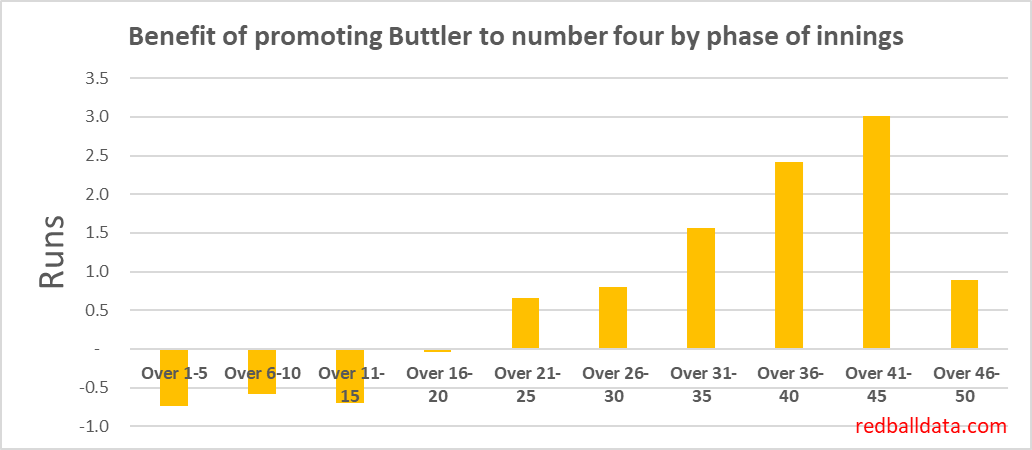
Fig 2 – modelled impact of moving Buttler to bat at four rather than six. x-axis represents the over in which the second wicket falls.
The chart shows that promoting the swashbuckling Buttler too early has a slightly adverse impact on expected runs (he’s not the person you want at the crease as you rebuild – hold him back). If the second wicket falls any time after 20 overs, it is beneficial to move Buttler up to number four. The later in the innings the second wicket falls, the more important it is to promote Buttler.** That said, the benefit is less than one run for overs 20-30, so if the batsmen are concerned a fluid batting order could cause them to underperform, coaches should take heed.
Note that the benefit starts to shrink very late in the innings – as the number four will only face a handful of balls anyway.
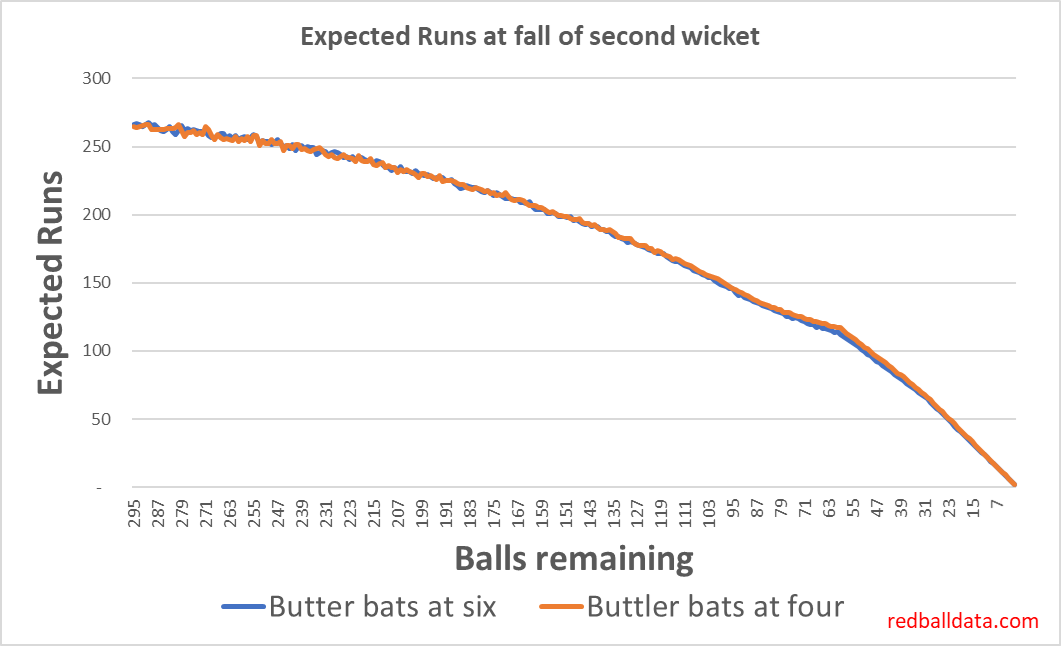
To put the previous chart into context, here’s a comparison between the two scenarios:
Fig 3 – Modelled median runs scored after the fall of the second wicket. x-axis shows different stages in the innings when the second wicket falls.
The two curves are very similar. If your eyes (and/or phone resolution) are up to it, you’ll see that the blue line (Buttler in at six) underperforms the orange line, especially in the latter stages of the innings.
England have an analyst with a ball-by-ball ODI model. Has he already done this analysis and are England already applying it? Consider the evidence of the World Cup Group Stages:
#6 vs Australia. Comfortably chasing 224 when the second wicket fell with the score on 147 in the 20th over. Morgan bats at four, England don’t lose another wicket.
#4 vs New Zealand. Second wicket falls in the 31st over. Buttler promoted to four.
#6 vs India. Second wicket falls in the 31st over. Third wicket falls in the 32nd over. Buttler bats at six? Takes revenge on the ball, scoring 20 from eight balls.
#6 vs Australia. England 53-4 in the 14th over when Buttler comes to the crease. Couldn’t realistically hold him back any longer.
#6 vs Sri Lanka. England three down inside 20 overs, Buttler held back to number six.
#5 vs Afghanistan. England 169-2 after 29.5. Morgan goes in, hits 148 (71). Buttler doesn’t get a turn until the third wicket falls in the 47th over.
#4 vs Bangladesh. 205-2 (31.3). Buttler promoted to four.
#6 vs Pakistan. England three down with just 86 on the board. Buttler comes in when the fourth wicket falls.
#6 vs South Africa. 111-3 (19.1). England play it safe and Buttler bats at six. Fair enough.
England’s strategy broadly follows the recommendations in this post (and therefore what an ODI simulator would recommend). Two exceptions: against Afghanistan and India. It would be fascinating to know why Buttler batted at four against New Zealand, but not (in similar circumstances) against India.
We can conclude that with their current batting order, England should move Jos Buttler up the batting order if the second wicket falls after the 30th over. A word of caution – the 90million balls I modelled were for this specific scenario, and not the general case. If you would like me to consider another scenario, please do get in touch via the “Contact” page or @edmundbayliss on twitter.
*If I had my time again I wouldn’t have had England playing against themselves and at a ground with high ODI batting averages. Regrettably, I neglected to update those inputs after a World Cup game there. If the modelled runs in this piece feel high to you, that’s why.
**It’s human nature to pick one reason for an outcome. “If the coach had just tweaked the order, we would have put enough on the board”. It’s seldom that clear cut. These batting order changes are worth up to three runs, very much in the “extra one percent” territory.
There are suspicions afoot that England have an ODI weakness at the home of Cricket.
CricViz’s analysis is here. In a nutshell, England struggle when the ball does a bit. Lord’s is a prime example of that, hence England have lost two of their last five games there and are vulnerable. It’s a neat piece of work.
And yet… Cricket is an individual sport masquerading as a team one. “England” as a batting lineup is a myth. In this piece I’ll explore the expected top seven for the game on 25th June 2019 and their track record in white ball cricket at Lord’s.
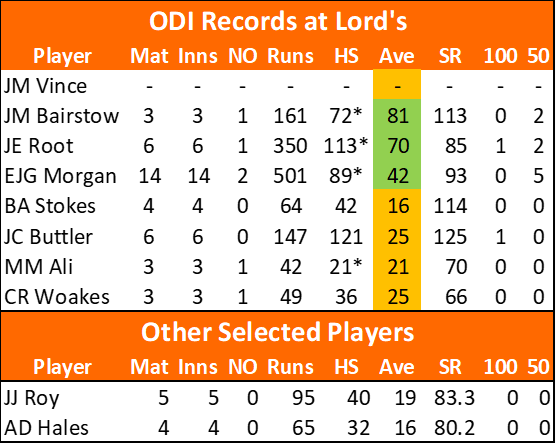
Firstly, ODI records.
Fig 1- ODI Records of selected England players at Lord’s
We can eliminate Bairstow, Root and Morgan from our enquiries. They have done well. Also, it’s Morgan’s home ground – surely he is familiar enough with conditions to not be at a disadvantage?
Note how Roy and Hales have been something of a flop at Lord’s. They aren’t playing tomorrow so we can put them to one side. That leaves Vince, Stokes, Buttler, Ali & Woakes under the spotlight. None of them have played a T20I at Lord’s but we can look at their Test Match record.
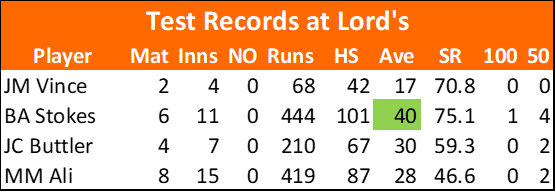
Fig 2: Test Records
Stokes has a decent red ball record at Lord’s. Not the same discipline, will let you make your own mind up.
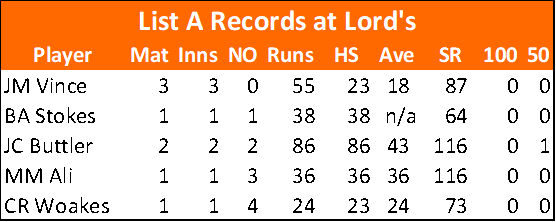
List A records – note the very small sample size. Because Stokes, Buttler, Ali & Woakes all play in the North group, they rarely get the chance to play at Lord’s. Can’t read much into this.
How about the 20-20 record?
Oh. As far as I can tell none of Stokes / Buttler / Ali / Woakes have batted in a 20-20 at Lord’s. Vince has, and it hasn’t gone well.
What can we conclude? Firstly, county players generally stick to their half of the country when it comes to white ball Cricket, and many will only have strapped on their coloured pads in a minority of England’s grounds. Secondly, the jury is still out on Stokes / Buttler / Ali at Lord’s. More data please! Finally, over six white ball innings and four Test innings Vince has 151 runs at 15.1 – that’s not good.
Rugby Union has a representative team called the Barbarians. They are something of an oddity in the professional era – an invitational team who play against international sides in exhibition matches. These are high scoring, free flowing matches that encourage an attacking and entertaining spectacle. It’s a great antidote to the win-at-all-costs culture that has come with professionalism.
Cricket has a significant gap between the top ODI teams and the rest. Matches between these sides will rarely be balanced – since 2015 there have been 69 games between the top eight sides and Non-World-Cup (NWC) teams. The NWCs have won just five and tied one. There were likely some pretty dull days among the 63 defeats. The perception is that it’s hard to sell these games, so boards would rather have long series between the top teams than host a “minnow”.
How about we use the first paragraph as a solution to the second? Picture an invitational side, the best of the NWC teams*, playing an exhibition 50 over match at Lord’s against an England XI to start the international summer. No stats or averages up for grabs. No wider context, apart from the love of Cricket and a desire to grow the game by giving the best-of-the-rest a chance to show what they can do.
It has been tried before, a three day warm up game in 2012. England scraped a three wicket win in a balanced contest. A shortened red ball practice match might not be the right format – it’s unlikely to pull in the crowds in the way an exhibition 50 over game could.
Marketing these games would not be taxing – take a leaf out of the Barbarians book and have big name guest coaches (such as Kumar Sangakkara). The Baa-Baas have a nice touch where each player wears their own club socks to complement the black and white hoops of the Barbarians kit. This MCC NWC XI could do something similar with Helmets**.
Numbers time
Since this is redballdata.com, we’d better have some stats to support the idea that a composite Barbarian team would be more successful than individual countries.
This isn’t intended to be a comprehensive review of who the best NWC players are – more an indicative view of how players have fared against the best ODI sides. Bertus de Jong is a useful source on Associate Cricket, if you’d like to know more.
Here’s some candidates to be on display for this theoretical XI, based on performances against the World Cup teams since 2015. It would be easy to find a competitive top six from these players, ideally not just drawing players from the 11-13th best teams (Ireland, Scotland and Zimbabwe). Note that no individual team can field seven players who have averaged over 27 against the big names.
Fig 1: ODI Batting 2015-2019, NWC vs World Cup Teams. Ranked by average. Excludes players that retired before 1/1/18.
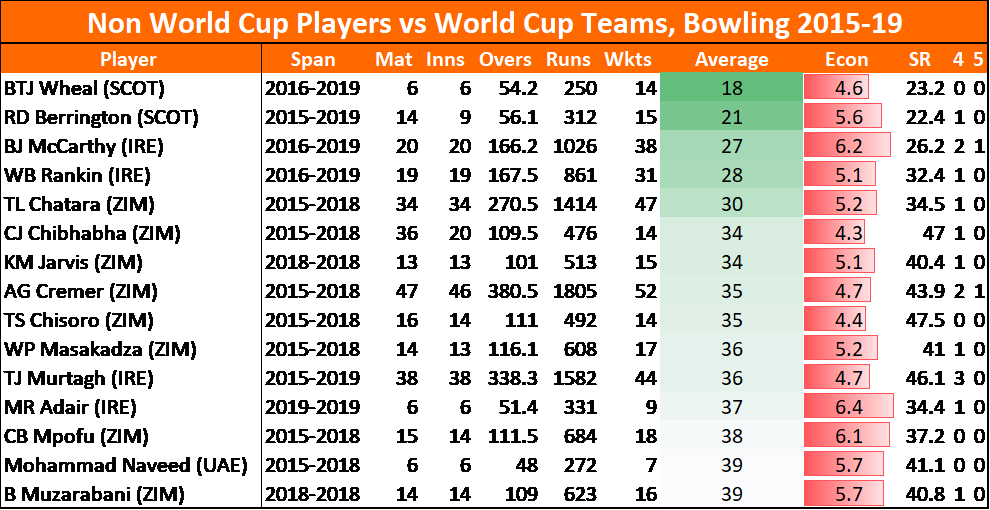
As for bowling, not many great averages, but these Economy rates would keep the NWC XI in the game. As for individual countries, Zimbabwe have plenty of bowling which could challenge the top ODI teams. Ireland and Scotland don’t have that depth.
Fig 2: ODI Bowling 2015-2019, NWC vs World Cup Teams. Ranked by average. Excludes players that retired before 1/1/18.
This Barbarian concept could work. The hosts would get a spectacle and something a little different for the fans, while giving the Associates & Affiliates a chance for their best players to gain experience of competing against a top team.
*If this comes across as condescending to the sides ranked 11-20, it isn’t intended to. The world is getting smaller, and if Cricket doesn’t widen its popularity, richer sports will. Think of this proposal as a means to an end, building towards bilateral series.
** It may not surprise you to learn that I don’t work in Marketing.
Further Reading
The Cricketer magazine flagged the best players missing from the 2019 World Cup in an article here.
Here are some highlights of an England vs Barbarians fixture in 2018.
Like most sports fans my weekends can include shouting at the radio. Unlike most sports fans I’m usually het up about statistics, not necessarily the performances on the field.
Last weekend it was claimed that the Indian middle order has
a weakness against left arm pace in ODIs. I won’t name the individual that said
it, because they are an excellent commentator and this isn’t intended to be a
criticism of them.
What’s wrong with that claim? Left arm pace bowlers are normally front line bowlers, so are better than the average bowler. That means that when it is said that “X does badly against left arm quicks” we really mean “X is less good against the better bowlers”. Of course they are, we all are!
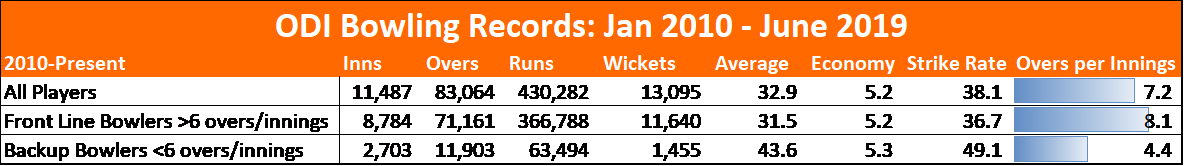
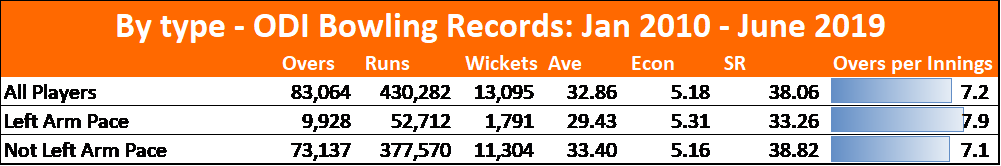
Time for a couple of charts. Firstly, there’s a clear distinction between performance of front line bowlers (ie. those that bowl on average more than six overs per innings) and the “change” bowlers:
Fig 1: Bowling records for the 10 World Cup teams this decade.
Note the key difference in average between front line and backup bowlers – 12.1 runs per wicket. It’s likely that the backup bowlers bowl in the middle overs, so flattering their Economy Rates compared to the bowlers trusted to finish the innings.
Sampling the data in any way that includes a greater proportion
of front line bowlers will give metrics that indicate batsmen are struggling.
For instance, by only measuring performance against left arm pace bowlers!
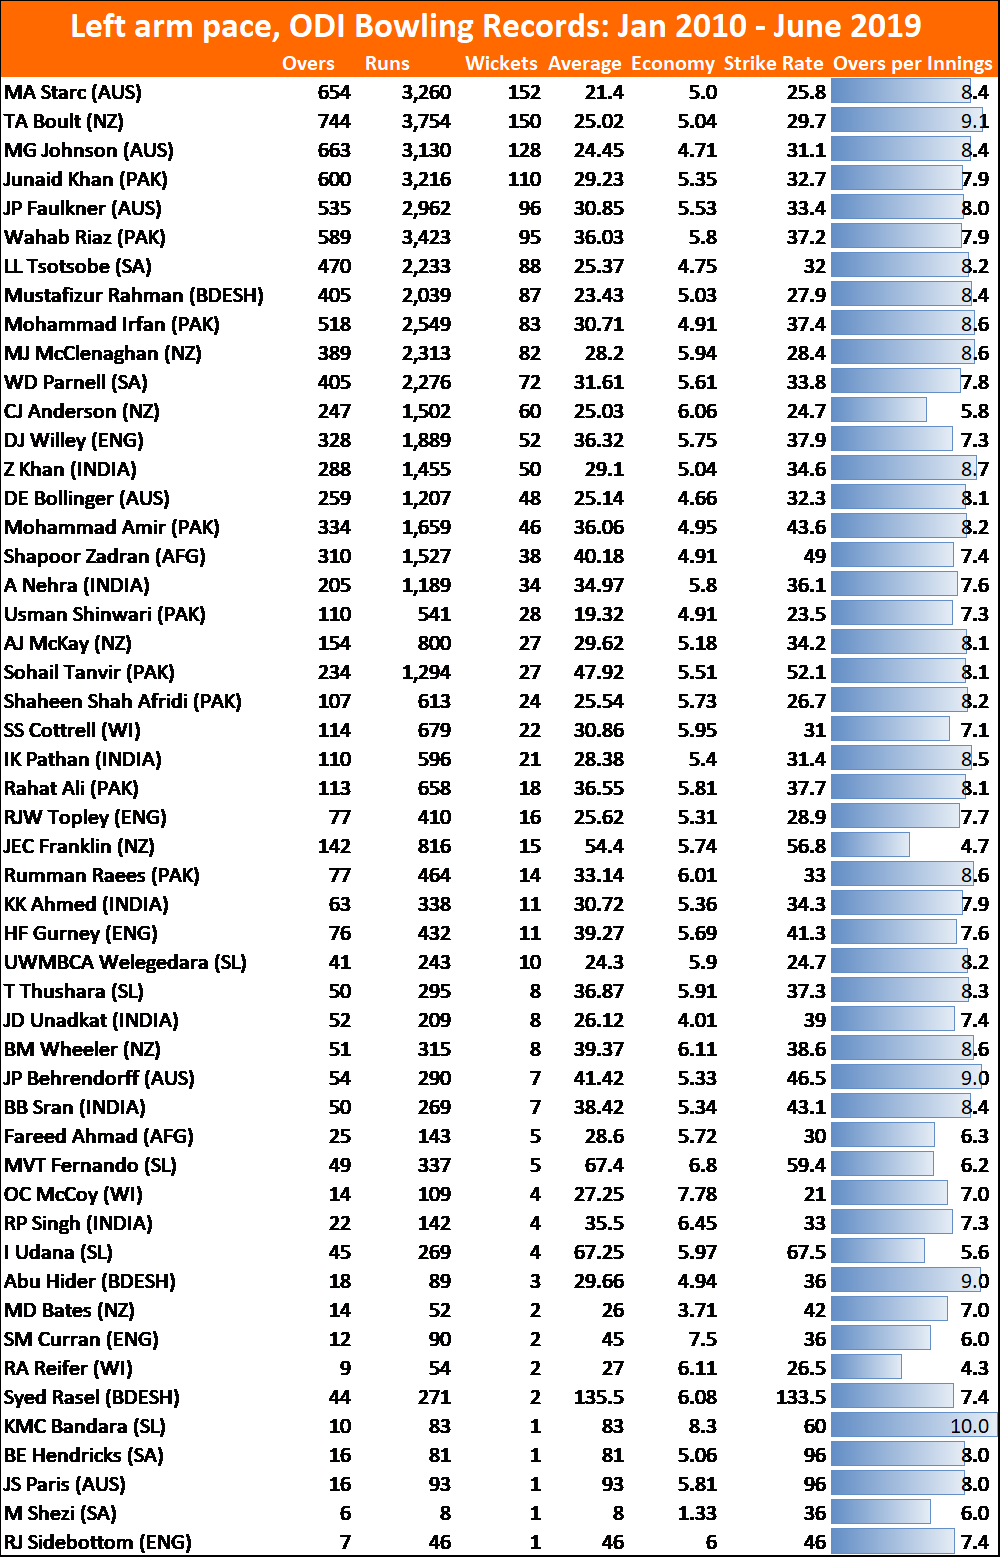
Next, the same view as above, but with left arm pace bowlers. Note how high the average overs per innings are for left arm pace bowlers. There’s a full list of bowlers at the end of this piece.
Fig 2: Bowling records for the 10 World Cup teams this decade. Split between left arm pace and others.
Left arm pace bowlers average 12% less than other bowlers (admittedly while conceding runs 3% faster). For analysis of the advantages left arm pace bowlers have, refer to this Cricinfo article http://www.espncricinfo.com/magazine/content/story/851399.html
But why wouldn’t there be part-time Left arm quicks? It
could be margin of error: bowling over the wicket to a right hander, straying
onto the pads is risky while conservatively keeping a consistent line outside
the off stump takes bowled and LBW out of the equation.
Summing up, we can draw two conclusions. When considering performance against a sub group of bowlers, one needs to adjust for the quality of that sub-group. The smaller the sub-group, the more careful you need to be. Also, expect all batsmen to average 12% less against left arm pace bowlers in ODIs.
Appendix
Fig 3: All left arm pace bowlers to have played ODI Cricket for the 10 world cup teams since 2010.
There’s barely a part-timer in the group. Only Anderson, Franklin, Udana, Reifer averaged less than six overs per innings – and Raymon Reifer has only played two games!
Still reading? Here’s another example to make the point: imagine a naïve Cricket Analyst for a Test team at the end of last Century. Crunching the numbers they see that most batsmen underperform against leg spin, so recommend the selectors fast track a ‘leggie’. The unfortunate Analyst didn’t notice that there weren’t very many leg spinners out there. All they’ve really discovered is that it wasn’t easy to face Shane Warne, Mushtaq Ahmed or Stuart Macgill. That’s not especially insightful: right data, wrong conclusion.
There’s a theory (which I just invented) that you could listen to old radio broadcasts of Cricket and be able to judge the date by the buzzwords of the era. For 2019, it’s “Matchups”: pitting bowlers against the optimum batsmen to stifle run scoring and take cheap wickets.
Matchups seem like a plausible proposition – get enough data, find some patterns, check you’ve got a decent sample size and out will pop some options to consider. Note the need for a plausible proposition (ie. not “Roy struggles against the flipper in the top of the hour when the bowling is from the North-West”).
There are three issues I have with the use of Matchups.
Firstly, they aren’t publicly available – if a pundit refers to X having a weakness against a particular type of bowling, the viewer/listener has no way of knowing if that’s a fact or an opinion. In times gone by, we could accept that all such utterances were opinions, and who better to go to for opinions than people who report on the game for a living? The balance has shifted – so now when hearing “Bairstow struggles against spin early in the innings”, it could be opinion, bad data*, or a solid piece of analysis. There’s something unsatisfying about that.
Secondly, we don’t know if Matchups work. If each one is a hypothesis, it should be easy to aggregate them in order to compare results and expectation. I expect much of this is – understandably – happening behind closed doors. My hunch is also that many Matchups evaporate as statistical flukes, so are of no benefit. If you’re aware of a rigorous assessment of Matchups, please do drop me a line on twitter or via the Contact page on this site.
Finally, and of relevance to the Cricket World Cup, there’s an opportunity cost associated with changing bowling plans. Especially in ODIs where bowlers need rest during an innings.
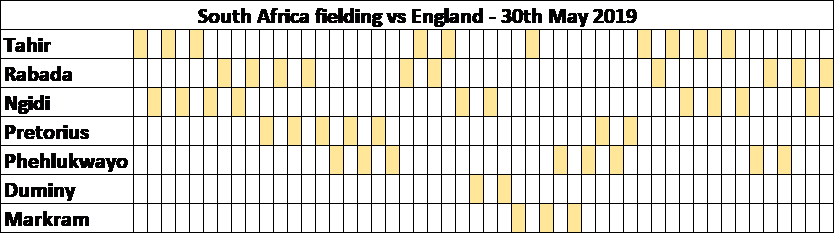
Let’s explore that Opportunity Cost – what are the downsides of opening with spin? We can expect more teams to open with spin against England after Bairstow fell first ball against Imran Tahir. Here’s how South Africa used their bowling resources that day:
Fig 1: Overs bowled by each player
Early wickets have a big impact on expected score – but one cannot fully appraise the impact of opening with Tahir without taking all factors into account.
Rabada didn’t get the new ball. He then had to condense 10 overs into 44, rather than across 50 – does that impact the pace he can bowl?
After 24 overs, with the score on 131-3, Faf du Plessis threw the ball to JP Duminy. Five of the next eight overs were bowled by Duminy and Markram. On this occasion it worked – 5-0-30-0 is not too bad. But it’s the big picture that matters, not one innings.
Pretorius only bowled seven overs, Phehlukwayo eight. Without a medium pacer or second spinner than can bowl 10 overs in a row, once a team opens with spin, they are probably going to underuse their fourth and fifth bowler.
What are the factors to consider when weighing up whether to open with a spinner in a four pace / one spin attack?
Will it work? What is the increase in chance of a wicket versus the default option?
What are the relative strengths of your sixth (and possibly seventh) best bowlers, compared to your fourth and fifth?
How fit is the bowler who won’t now be opening? Are you confident they can bowl 10 out of 44 overs? How many days since your last game?
What have we learned? The value of a Matchup is the expected gain from one pairing over another, less the downsides of changing the bowling order to accommodate using a specific bowler at a particular time.
* A word on bad data: Andrew Strauss averaged 91.5 against Mitchell Johnson in Tests. It’s a nice piece of trivia, but it’s only based on Strauss scoring 183-2 against Johnson. I doubt this would have much predictive power. Using that as a basis of prediction is roughly the equivalent of writing off Graham Gooch after he bagged a pair on debut.
Further reading: Cricmetric.com claims to have Matchup data for Batsmen vs Bowlers – I’ve no reason to doubt their data.


_method_of_adjusting_target_scores.PNG#/media/File:(Duckworth_Lewis)_method_of_adjusting_target_scores.PNG)