
During a rain delay at Johannesburg last week, the radio commentators were putting an all-time England XI together. The usual arguments ensued: how can you compare players across eras? Is bowling average the sole measure? While looking at something quite unrelated, I realised I’d stumbled upon a new way of comparing players which is perfect for this question.
The metric is “percentage impact on batsman’s average”. For instance, batsmen generally scored 31% below their average facing Malcolm Marshall, making him the best Test bowler of the last 50 years.
Here’s the bowlers since 1970 with at least 150 wickets at under 25 apiece, ranked by their impact on a batsman’s average:

There are four other players whose average flatters them, where Impact on Batsman’s Average is a better metric. Joel Garner picked up 92 of his 259 wickets against a mixed England team. Muttiah Muralitharan and Waqar Younis benefited from a disproportionate number of games against Bangladesh, Zimbabwe and (in Younis’ case) Sri Lanka. Wasim Akram is the hardest to explain: 38% of his wickets were against batsmen with career averages under 20 (a 25% figure would be more normal).
Did you spot Vernon Philander muscle in at fourth on the list? A phenomenal bowler. His average (and Impact on Batsman’s average) may be boosted by favourable conditions where he happened to play most of his away games: England, Australia and New Zealand. Still, I won’t fudge the numbers: he has a brilliant record and South Africa will miss him.
Here’s a comparison of Philander and Muralitharan
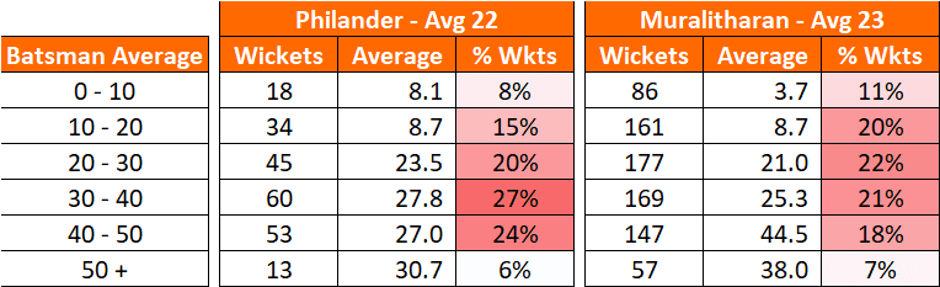
Contextual Averages
England have been defending Joe Denly’s average (30) lately by saying that his performances are better than they appear because of the conditions he has played in.
This piece supports that approach: Marshall and Garner had the same bowling average, but Marshall was 10% better than Garner. If averages can mask that kind of difference over a whole career, imagine how skewed an average could be after ten Tests.
Further Reading
ICC’s all time rankings. The ICC have listed players according to their peak performances, while I have used their career. Consider Akram – his average puts him fourteenth on the list, but accounting for who he dismissed the ICC rankings take him all the way down to 76th. That supports my calculations that he had a -11% impact on batsmen’s averages.

It’s a good idea to compare against batsman’s average. However, don’t you think we need to account change in the rules(free hit, boundary length etc..) as well?
LikeLike
There may be some impact, but most of that should be captured by changes to the batsman’s average.
Imagine if a fourth stump were added – bowling averages would reduce, but so would batting averages- thus this method would still fairly compare ability between eras.
LikeLike
Really enjoyed your blog. Perfect for someone like me, a statistician, trapped in an innumerate brain.
A couple of questions on this. Say you had a bowler who only bowled to two batsmen, A&B. A averages 50 generally but our guy gets him for 25. B averages 10 generally and 15 against this bowler. Do you score the bowler as (-25 +5)/60? i.e 33.33% reduction in average?
How do you deal with the batsmen the bowler concerned never gets out?
And a bigger issue. Are you underestimating spinners? My gut feel is a county side looking to recruit an overseas pro is better going for a spinner with an average of 25, than a fast bowler with an average of 30. Reason being, the spinner can bowl a higher percentage of your overs?
Is there anything in this? For instance, Murali 3.5 wickets a test innings, Malcolm Marshall 2.5. Would we get a better measure of value if the comparison was Marshall 2.5 * 31 = 77.5
Murali 3.5 * 20 = 70?
LikeLike
Thanks very much, glad you enjoyed it.
In terms of the methodology, your understanding is correct. Treating batsmen that weren’t dismissed isn’t a problem (I think) – just needs some re-framing of the question. Consider dismissing the batsman that averaged 50, then the batsman that averaged 10 – an average bowler would concede 60 runs to get those wickets. In your example the bowler conceded just 40 runs. The key is that it doesn’t matter which batsman scored those runs – it could even be someone that the bowler never dismissed. Wickets taken are of differing values, unlike runs conceded which are of equal value.
Your second question is a logical one. Am I underestimating spinners? I don’t think so, but not for any other reason than this exercise being trivial, a throwaway . The radio debate on ‘which bowlers were better’ bored me for the same reason: I don’t much care about . Far more interesting would be the choice a county team might face in picking an overseas player – great pace bowler or very good spinner? To answer that one would need a view of each players impact over a match (eg. old ball vs new ball, 1st innings vs 4th). I’m building a model to do just that – watch this space!
LikeLike
Look forward to the model.
Just on the numerical thing, I think I get it. Say now, three batsman. 1 average of 50 who our guy gets out for 25. One averaging 10 and our chap gets for 15 and one who scores 5 runs, but our bowler never gets him out. Calc is -25 +5 /50+10+5 = 30% reduction?
LikeLike