What’s a dropped catch worth in ODI Cricket?

Jason Roy dropped the ball today. I didn’t see it, but apparently it was rather an easy catch. Pakistan went on from 135-2 (24 overs) to finish 348-8, a score just out of England’s reach. The final winning margin was 14 runs.

What did that drop do to Pakistan’s expected score? Here’s the simulations for the two scenarios: 136-2 (24.1) and 135-3 (24.1)

Fig 1: Two scenarios for the 145th ball of Pakistan’s Innings: Out or one run scored.

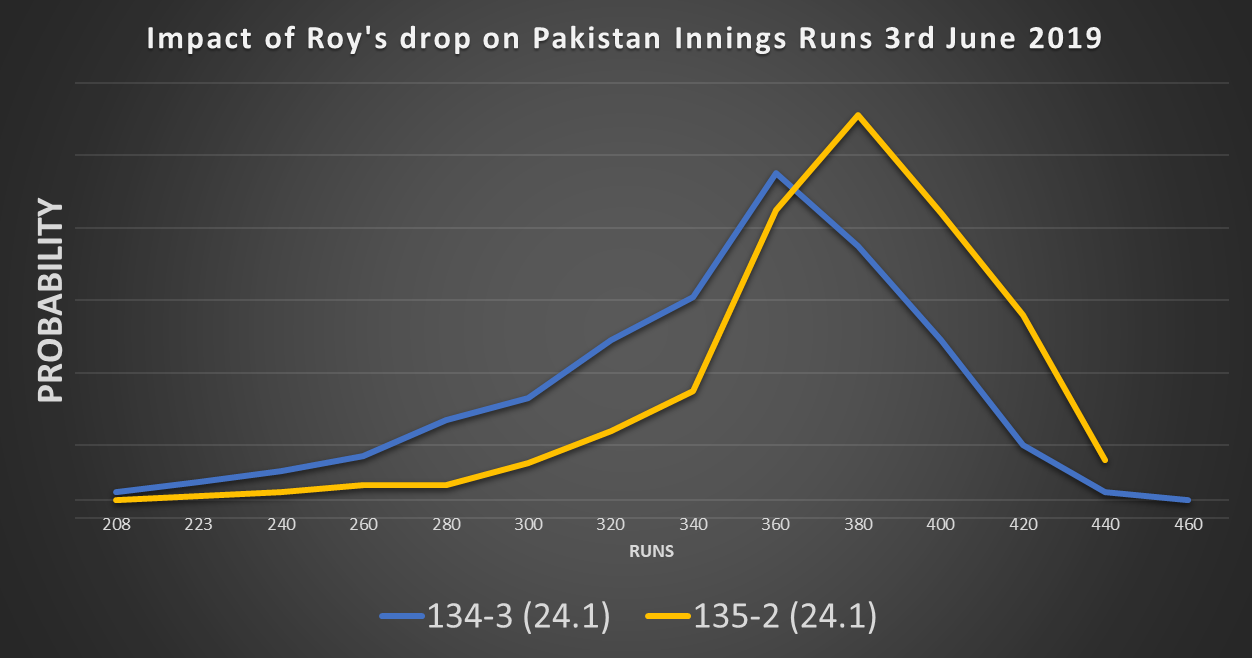
If Hafeez had been out, the mean score was 350, while the dropped catch increased the mean score to 377. That’s a 27 run impact.

Can we break that down?

  • Firstly, the runs scored on that ball. Value = one run. Easy.
  • Secondly, the reduced run rate as a new batsman plays themselves in. According to some analysis I’ve done on how batsmen play themselves in, that’s worth four runs (Hafeez had faced 12 balls by this point, so would have been just starting to accelerate).
  • The rest of the impact (22 runs) comes from two factors: more conservative batting as Pakistan from having fewer wickets in hand, and the increased chance of getting bowled out (and thus not using all their overs).

To generalise, the cost of a dropped catch would be a function of:

  • Runs scored on that ball
  • Whether the surviving batsman is set
  • How long left in the innings (the wicket affects the value of future deliveries. Thus the later in the innings a wicket falls, the lower the value of that wicket)
  • How many wickets the batting team has in hand (does the wicket cause more defensive batting)? In this case, being three wickets down after half the innings still leaves plenty of scope for aggressive batting so doesn’t have as big an impact as it could.
  • Strike Rate and Average of the reprieved batsman relative to the rest of the team (dropping Wahab Riaz is better than dropping Babar Azam).

Interesting topic. I might come back to this when other people drop sitters.

Fantastic boundaries and when to find them

Using a ball-by-ball database of 2019 ODIs, I’ve looked at boundary hitting through the innings. This was to refresh my ODI model, which was based on how people batted in 2011.

Fig 1: Boundary hitting by over. ODIs between the top nine teams, Q1 2019

Key findings:

  • First 10 over powerplay: 10% of balls hit for four, c.2% sixes. Just two fielders outside the ring.
  • Middle overs 10 – 40: c. 8% balls hit for four, c. 2% sixes. Four fielders outside the ring limits boundary options. Keeping wickets in hand mean batsmen don’t risk hitting over the top, though if wickets in hand the six hitting rate starts to pick up from the 30th over.
  • Overs 40-45: Six hitting reaches 5%. No increase in the number of fours: five boundary riders give bowlers plenty of cover.
  • Overs 46-50: Boundary rate c.18% with boundaries of both types picking up.

These probabilities have been added to the model, which now makes some sense and isn’t claiming a 6% chance England score 500!

An early view of what the model thinks for Thursday’s Cricket World Cup opener – if England bat first 342 is par. 69% chance England get to 300, 20% chance of England getting to 400. I can believe that, it is The Oval after all.

The ODIs they are a’changing

My ODI model was built in those bygone 260-for-six-from-50-overs days. Having dusted it off in preparation for the Cricket World Cup it failed its audition: England hosted Pakistan recently, passing 340 in all four innings. Every time, the model stubbornly refused to believe they could get there. Time to revisit the data.

Dear reader, the fact that you are on redballdata.com means you know your Cricket. Increased Strike Rates in ODIs are not news to you. This might be news to you though – higher averages cause higher strike rates.

Fig 1: ODI Average and Strike Rate by Year. Top 9 teams only. Note the strength of correlation.

Why should increasing averages speed up run scoring? Batsmen play themselves in, then accelerate*. The higher your batsmen’s averages, the greater proportion of your team’s innings is spent scoring at 8 an over.

Let’s explore that: Assume** everyone scores 15 from 20 to play themselves in, then scores at 8 per over. Scoring 30 requires 32 balls. Scoring 50 needs 46 balls, while hundreds are hit in 84 balls. The highest Strike Rates should belong to batsmen with high averages.

Here’s a graph to demonstrate that – it’s the top nine teams in the last ten years, giving 90 data points of runs per wicket vs Strike Rate

Fig 2: Runs per over and runs per wicket for the first five wickets for the top nine teams this decade, each data point is one team for one year. Min 25 innings.

Returning to the model, what was it doing wrong? It believed batsmen played the situation, and that 50-2 with two new batsmen was the same as 50-2 with two players set on 25*. Cricket just isn’t played that way. Having upgraded the model to reflect batsmen playing themselves in, now does it believe England could score 373-3 and no-one bat an eyelid? Yes. ODI model 3.0 is dead. Long live ODI model 4.2!

Fig 3: redballdata.com does white ball Cricket. Initially badly, then a bit better.

Still some slightly funny behaviour, such as giving England a 96% chance of scoring 200 off 128 or a 71% chance of scoring 39 off 15. Having said that, this is at a high scoring ground with an excellent top order. Will keep an eye on it.

In Summary, we’ve looked at how higher averages and Strike Rates are correlated, suggested that the mechanism for that is that over a longer innings more time is spent scoring freely, and run that through a model which is now producing not-crazy results, just in time for the World Cup.

*Mostly. Batsmen stop playing themselves in once you are in the last 10 overs. Which means one could look at the impact playing yourself in has on average and Strike Rate. But it’s late, and you’ve got to be up early in the morning, so we’ll leave that story for another day.

**Bit naughty this. I have the data on how batsmen construct their innings, but will be using it for gambling purposes, so don’t want to give it away for free here. Sorry.