Women’s T20 World Cup – Rating the teams

Now that every team (bar Pakistan) have played, I can use the batting and bowling records of each starting XI to paint a picture of what we can expect to happen in the group stages.

This is a quick and dirty piece of analysis – I’ve only used ODI and T20I data between the top nine teams. Scarcity of T20I data meant ODI was used as a proxy – scaling down the averages by 76% and increasing the strike rates by 147%. Time will tell how good this method is.

Somehow watching sport without understanding context and probabilities no longer satisfies me – I want to know what is happening, and to do that data is required. Hence this piece.

The below chart ranks batting strength on the x-axis (expected runs on an average pitch against an average attack). The y-axis is the same but for runs conceded. The ideal team would be in the bottom right of the chart.

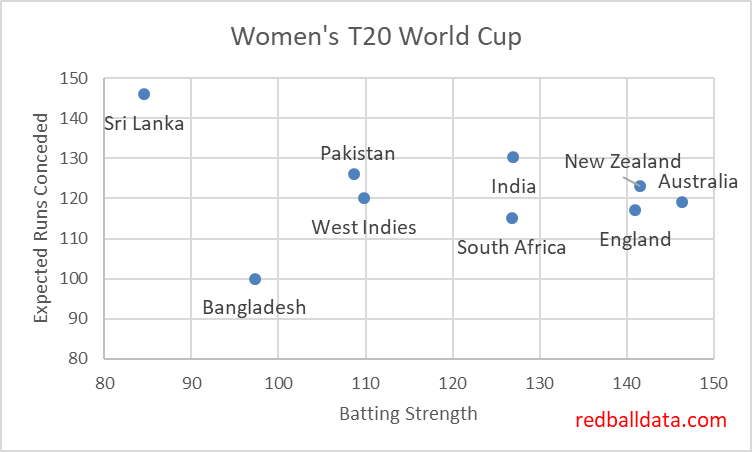
The big three stand out: Australia, New Zealand and England. These are consistent with the ICC rankings.

Let’s look at the groups.

Group A is marginally stronger. Despite beating Australia, India aren’t all that hot at batting – remove Shafali Verma early and the rest of the order are unlikely to score at much over a run a ball. Both India’s wins have come after Verma set a platform. Bangladesh have what is on paper an economical bowling attack, though having slipped up against India, they’ll have a tall order containing Australia and New Zealand.

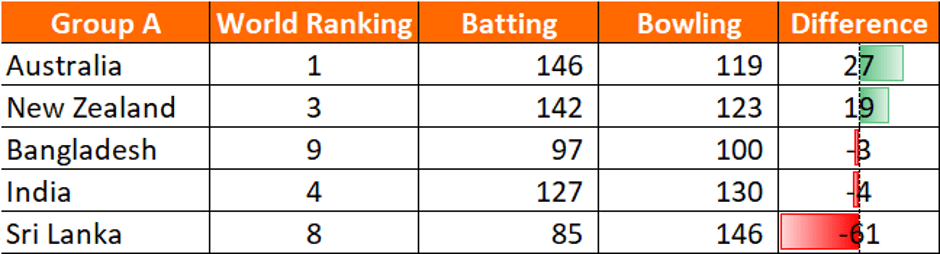
Current expectation is that two of Australia, New Zealand and India should go through. Australia vs New Zealand on 2nd March is the final game of the group, and is likely to decide both who goes through and the position they go through in.

Group B is more clear cut. England lost to South Africa, which was seen as something of an upset, though player data indicates the sides are fairly well matched.

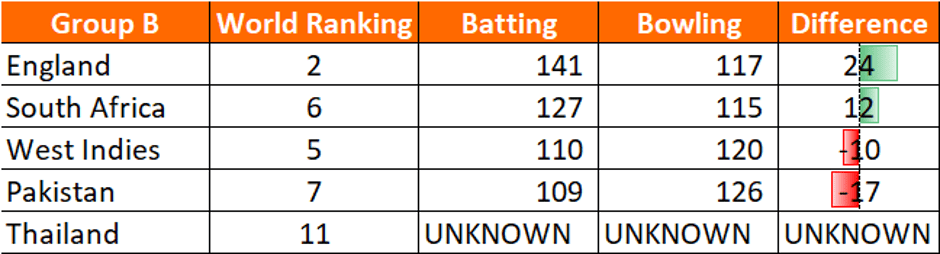
Aside from Chloe Tryon, South Africa aren’t an explosive batting unit. What they have in their favour is that they are dependable. Strong averages down the order mean they will rarely get rolled. That should be good enough to get them three wins out of four and into the semi finals. Note that the women’s version of T20 cricket is subtly different – with lower averages, teams are at much greater risk of being bowled out: so the averages of the lower middle order matter.

England are a similar proposition to South Africa – no stars with the bat, yet a top eight who should all yield more than a run a ball. Hard to see anyone other than England and South Africa progressing.

Being frank, West Indies and Pakistan are holed below the water line once three wickets are down. Look out for them wasting good starts.

Wrapping up, it’s hard to look past the big three teams. Still, South Africa at odds of 14-1 look tempting since I’d expect them to be the fourth semi-finalist. (Odds as at 25th Feb).

World Cup Bowling: Postmortem

Admittedly there’s a game to go, so this is a mid-mortem of how bowling has driven success.

Today (11th July), Australia’s fifth bowler was a combination of Steve Smith and Marcus Stoinis. Joint figures of 3-0-34-0 did not help their team’s cause when trying to defend 223. A canny side would try to pick off the ten overs Australia have to find from their weaker bowlers. Are the Australians particularly vulnerable here?

How effectively have the all-rounders bowled in the 2019 Cricket World Cup, and what can we learn from this?

All rounders – aggregate bowling performances at the 2019 Cricket World Cup. Sorted by bowling average. England and New Zealand players highlighted. Note the scarcity of averages under 35.

Bear in mind that the average runs per wicket across the tournament was 33.5, most all rounders under-performed the average by at least 10%.

Now to assess Cricket World Cup 2019 bowling on a country by country basis:

CWC 2019 bowling records split by Bowlers and All Rounders, by country. Note the core bowling units all average between 24 and 30. Averages for all rounders are higher, while Australia’s all rounders are an outlier: averaging 50 at an economy rate of 6.2.

Firstly, the semi-finalists.

Australia struggled with their fifth bowler through the World Cup. Maxwell bowled 49 wicketless overs, and all five all rounders went for over a run a ball. Combine that with the weakness in the number eight batting slot, and you can see why expectations for Australia were low coming into the tournament.

Given Starc’s relentless 27 wickets at 19, it was surprising that Australia’s front line bowlers averaged as much as 30 with the ball – Lyon/Coulter-Nile/Zampa conceded 697 to pick up just 12 wickets. This attack was the weakest performing of the four semi-finalists, which makes it incredible that they won 70% of their matches. Well batted Warner and Finch.

There’s a tight grouping for New Zealand, India and England. If India have a weakness it was that Hardik Pandya’s bowling averaged 45 over nine matches. With a career average of 41, that puts pressure onto the rest of the attack. Taken individually, a spell like 10-0-55-1 (his semi-final performance) is disappointing but acceptable. However India’s problem is that that’s near his average, and opponents can expect low risk runs. If India had a stronger fifth bowler New Zealand may not have accrued 239 runs.

Of course selectors have to balance batting and bowling – it’s just that England have Stokes and Woakes so don’t really need to concern themselves with that conundrum. Similarly, New Zealand have Neesham and Williamson.

Next we look at the sides that didn’t make it to the semis:

CWC 2019 bowling records split by Bowlers and All Rounders, by country – teams eliminated at the group stage only. Circles represent front line bowlers, crosses are all rounders.

Funny how a cold look at the data changes your perspective. I hadn’t realised all of Sri Lanka, Afghanistan, Bangladesh and West Indies averaged over 39 with the ball. Little wonder their collective record was W8 – L29: if you let a team get to 150-3, they’ll bat you out of the game.

A word on Shakib Al Hasan – his bowling figures don’t stand out (he ended with 11 wickets at 36). His batting more than made up for it though (606 runs at 87). A great combination of fantastic batting and sending down more than nine overs each innings.

It wasn’t the bowling that let South Africa down. The need to find replacements for Amla and Duminy is pressing.

Pakistan have the greatest discrepancy between the specialist bowlers and the all-rounders. Shadab Khan (tournament figures 2-188) and Imad Wasim (2-189) repeatedly let teams off the hook. Some may be surprised that Khan, who in his last ODI batted at number nine, is listed as an all-rounder. His batting average says he is, yet his strike rate and boundary hitting say otherwise. Time will tell.

What have we learned? Five teams at this tournament had successful front line bowlers. The teams contesting the final on Sunday could also rely on their all rounders getting wickets; that sets England and New Zealand apart from the others.

Bowling averages at the 2019 Cricket World Cup correlated with winning rates

England Batsmen at Lord’s

There are suspicions afoot that England have an ODI weakness at the home of Cricket.

CricViz’s analysis is here. In a nutshell, England struggle when the ball does a bit. Lord’s is a prime example of that, hence England have lost two of their last five games there and are vulnerable. It’s a neat piece of work.

And yet… Cricket is an individual sport masquerading as a team one. “England” as a batting lineup is a myth. In this piece I’ll explore the expected top seven for the game on 25th June 2019 and their track record in white ball cricket at Lord’s.

Firstly, ODI records.

Fig 1- ODI Records of selected England players at Lord’s

We can eliminate Bairstow, Root and Morgan from our enquiries. They have done well. Also, it’s Morgan’s home ground – surely he is familiar enough with conditions to not be at a disadvantage?

Note how Roy and Hales have been something of a flop at Lord’s. They aren’t playing tomorrow so we can put them to one side. That leaves Vince, Stokes, Buttler, Ali & Woakes under the spotlight. None of them have played a T20I at Lord’s but we can look at their Test Match record.

Fig 2: Test Records

Stokes has a decent red ball record at Lord’s. Not the same discipline, will let you make your own mind up.

List A records – note the very small sample size. Because Stokes, Buttler, Ali & Woakes all play in the North group, they rarely get the chance to play at Lord’s. Can’t read much into this.

How about the 20-20 record?

Oh. As far as I can tell none of Stokes / Buttler / Ali / Woakes have batted in a 20-20 at Lord’s. Vince has, and it hasn’t gone well.

What can we conclude? Firstly, county players generally stick to their half of the country when it comes to white ball Cricket, and many will only have strapped on their coloured pads in a minority of England’s grounds. Secondly, the jury is still out on Stokes / Buttler / Ali at Lord’s. More data please! Finally, over six white ball innings and four Test innings Vince has 151 runs at 15.1 – that’s not good.

Matchups and Opportunity Cost

There’s a theory (which I just invented) that you could listen to old radio broadcasts of Cricket and be able to judge the date by the buzzwords of the era. For 2019, it’s “Matchups”: pitting bowlers against the optimum batsmen to stifle run scoring and take cheap wickets.

Matchups seem like a plausible proposition – get enough data, find some patterns, check you’ve got a decent sample size and out will pop some options to consider. Note the need for a plausible proposition (ie. not “Roy struggles against the flipper in the top of the hour when the bowling is from the North-West”).

There are three issues I have with the use of Matchups.

Firstly, they aren’t publicly available – if a pundit refers to X having a weakness against a particular type of bowling, the viewer/listener has no way of knowing if that’s a fact or an opinion. In times gone by, we could accept that all such utterances were opinions, and who better to go to for opinions than people who report on the game for a living? The balance has shifted – so now when hearing “Bairstow struggles against spin early in the innings”, it could be opinion, bad data*, or a solid piece of analysis. There’s something unsatisfying about that.

Secondly, we don’t know if Matchups work. If each one is a hypothesis, it should be easy to aggregate them in order to compare results and expectation. I expect much of this is – understandably – happening behind closed doors. My hunch is also that many Matchups evaporate as statistical flukes, so are of no benefit. If you’re aware of a rigorous assessment of Matchups, please do drop me a line on twitter or via the Contact page on this site.

Finally, and of relevance to the Cricket World Cup, there’s an opportunity cost associated with changing bowling plans. Especially in ODIs where bowlers need rest during an innings.

Let’s explore that Opportunity Cost – what are the downsides of opening with spin? We can expect more teams to open with spin against England after Bairstow fell first ball against Imran Tahir. Here’s how South Africa used their bowling resources that day:

Fig 1: Overs bowled by each player

Early wickets have a big impact on expected score – but one cannot fully appraise the impact of opening with Tahir without taking all factors into account.

  • Rabada didn’t get the new ball. He then had to condense 10 overs into 44, rather than across 50 – does that impact the pace he can bowl?
  • After 24 overs, with the score on 131-3, Faf du Plessis threw the ball to JP Duminy. Five of the next eight overs were bowled by Duminy and Markram. On this occasion it worked – 5-0-30-0 is not too bad. But it’s the big picture that matters, not one innings.
  • Pretorius only bowled seven overs, Phehlukwayo eight. Without a medium pacer or second spinner than can bowl 10 overs in a row, once a team opens with spin, they are probably going to underuse their fourth and fifth bowler.

What are the factors to consider when weighing up whether to open with a spinner in a four pace / one spin attack?

  1. Will it work? What is the increase in chance of a wicket versus the default option?
  2. What are the relative strengths of your sixth (and possibly seventh) best bowlers, compared to your fourth and fifth?
  3. How fit is the bowler who won’t now be opening? Are you confident they can bowl 10 out of 44 overs? How many days since your last game?

What have we learned? The value of a Matchup is the expected gain from one pairing over another, less the downsides of changing the bowling order to accommodate using a specific bowler at a particular time.

* A word on bad data: Andrew Strauss averaged 91.5 against Mitchell Johnson in Tests. It’s a nice piece of trivia, but it’s only based on Strauss scoring 183-2 against Johnson. I doubt this would have much predictive power. Using that as a basis of prediction is roughly the equivalent of writing off Graham Gooch after he bagged a pair on debut.

Further reading: Cricmetric.com claims to have Matchup data for Batsmen vs Bowlers – I’ve no reason to doubt their data.

What’s a dropped catch worth in ODI Cricket?

Jason Roy dropped the ball today. I didn’t see it, but apparently it was rather an easy catch. Pakistan went on from 135-2 (24 overs) to finish 348-8, a score just out of England’s reach. The final winning margin was 14 runs.

What did that drop do to Pakistan’s expected score? Here’s the simulations for the two scenarios: 136-2 (24.1) and 135-3 (24.1)

Fig 1: Two scenarios for the 145th ball of Pakistan’s Innings: Out or one run scored.

If Hafeez had been out, the mean score was 350, while the dropped catch increased the mean score to 377. That’s a 27 run impact.

Can we break that down?

  • Firstly, the runs scored on that ball. Value = one run. Easy.
  • Secondly, the reduced run rate as a new batsman plays themselves in. According to some analysis I’ve done on how batsmen play themselves in, that’s worth four runs (Hafeez had faced 12 balls by this point, so would have been just starting to accelerate).
  • The rest of the impact (22 runs) comes from two factors: more conservative batting as Pakistan from having fewer wickets in hand, and the increased chance of getting bowled out (and thus not using all their overs).

To generalise, the cost of a dropped catch would be a function of:

  • Runs scored on that ball
  • Whether the surviving batsman is set
  • How long left in the innings (the wicket affects the value of future deliveries. Thus the later in the innings a wicket falls, the lower the value of that wicket)
  • How many wickets the batting team has in hand (does the wicket cause more defensive batting)? In this case, being three wickets down after half the innings still leaves plenty of scope for aggressive batting so doesn’t have as big an impact as it could.
  • Strike Rate and Average of the reprieved batsman relative to the rest of the team (dropping Wahab Riaz is better than dropping Babar Azam).

Interesting topic. I might come back to this when other people drop sitters.

Fantastic boundaries and when to find them

Using a ball-by-ball database of 2019 ODIs, I’ve looked at boundary hitting through the innings. This was to refresh my ODI model, which was based on how people batted in 2011.

Fig 1: Boundary hitting by over. ODIs between the top nine teams, Q1 2019

Key findings:

  • First 10 over powerplay: 10% of balls hit for four, c.2% sixes. Just two fielders outside the ring.
  • Middle overs 10 – 40: c. 8% balls hit for four, c. 2% sixes. Four fielders outside the ring limits boundary options. Keeping wickets in hand mean batsmen don’t risk hitting over the top, though if wickets in hand the six hitting rate starts to pick up from the 30th over.
  • Overs 40-45: Six hitting reaches 5%. No increase in the number of fours: five boundary riders give bowlers plenty of cover.
  • Overs 46-50: Boundary rate c.18% with boundaries of both types picking up.

These probabilities have been added to the model, which now makes some sense and isn’t claiming a 6% chance England score 500!

An early view of what the model thinks for Thursday’s Cricket World Cup opener – if England bat first 342 is par. 69% chance England get to 300, 20% chance of England getting to 400. I can believe that, it is The Oval after all.