Admittedly there’s a game to go, so this is a mid-mortem of how bowling has driven success.
Today (11th July), Australia’s fifth bowler was a combination of Steve Smith and Marcus Stoinis. Joint figures of 3-0-34-0 did not help their team’s cause when trying to defend 223. A canny side would try to pick off the ten overs Australia have to find from their weaker bowlers. Are the Australians particularly vulnerable here?
How effectively have the all-rounders bowled in the 2019 Cricket World Cup, and what can we learn from this?

Bear in mind that the average runs per wicket across the tournament was 33.5, most all rounders under-performed the average by at least 10%.
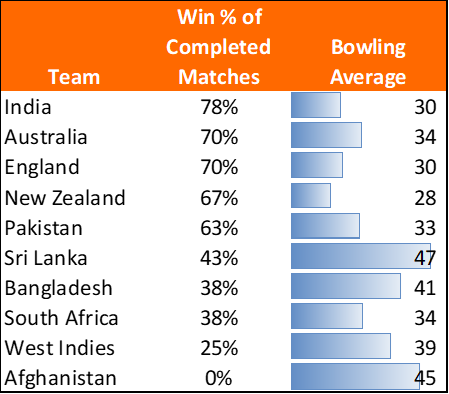
Now to assess Cricket World Cup 2019 bowling on a country by country basis:
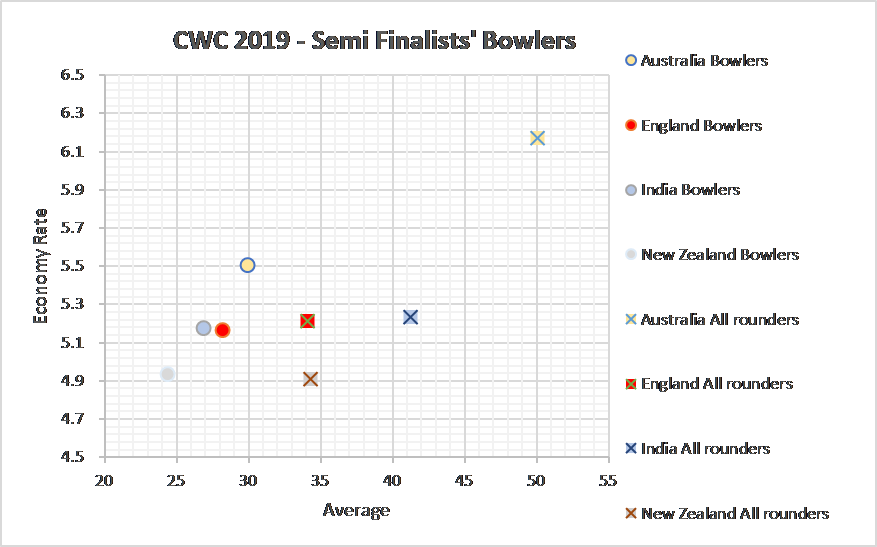
Firstly, the semi-finalists.
Australia struggled with their fifth bowler through the World Cup. Maxwell bowled 49 wicketless overs, and all five all rounders went for over a run a ball. Combine that with the weakness in the number eight batting slot, and you can see why expectations for Australia were low coming into the tournament.
Given Starc’s relentless 27 wickets at 19, it was surprising that Australia’s front line bowlers averaged as much as 30 with the ball – Lyon/Coulter-Nile/Zampa conceded 697 to pick up just 12 wickets. This attack was the weakest performing of the four semi-finalists, which makes it incredible that they won 70% of their matches. Well batted Warner and Finch.
There’s a tight grouping for New Zealand, India and England. If India have a weakness it was that Hardik Pandya’s bowling averaged 45 over nine matches. With a career average of 41, that puts pressure onto the rest of the attack. Taken individually, a spell like 10-0-55-1 (his semi-final performance) is disappointing but acceptable. However India’s problem is that that’s near his average, and opponents can expect low risk runs. If India had a stronger fifth bowler New Zealand may not have accrued 239 runs.
Of course selectors have to balance batting and bowling – it’s just that England have Stokes and Woakes so don’t really need to concern themselves with that conundrum. Similarly, New Zealand have Neesham and Williamson.
Next we look at the sides that didn’t make it to the semis:
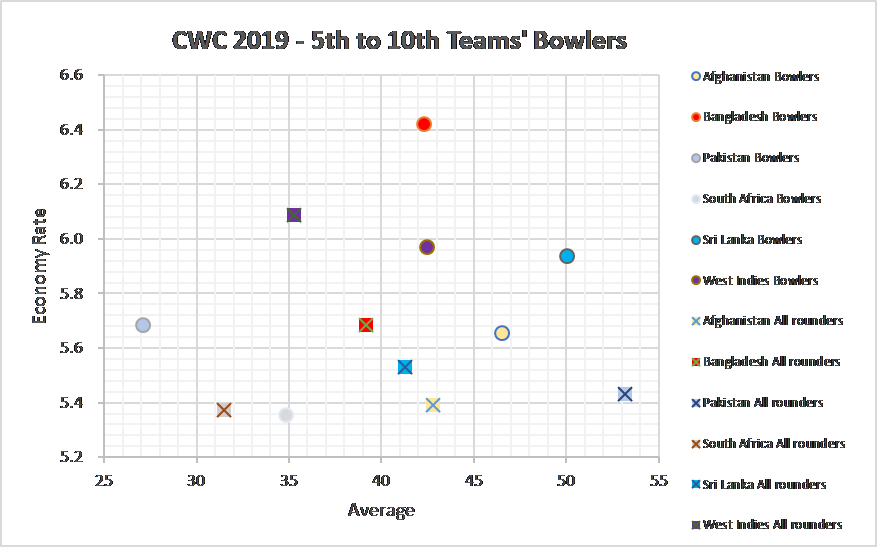
Funny how a cold look at the data changes your perspective. I hadn’t realised all of Sri Lanka, Afghanistan, Bangladesh and West Indies averaged over 39 with the ball. Little wonder their collective record was W8 – L29: if you let a team get to 150-3, they’ll bat you out of the game.
A word on Shakib Al Hasan – his bowling figures don’t stand out (he ended with 11 wickets at 36). His batting more than made up for it though (606 runs at 87). A great combination of fantastic batting and sending down more than nine overs each innings.
It wasn’t the bowling that let South Africa down. The need to find replacements for Amla and Duminy is pressing.
Pakistan have the greatest discrepancy between the specialist bowlers and the all-rounders. Shadab Khan (tournament figures 2-188) and Imad Wasim (2-189) repeatedly let teams off the hook. Some may be surprised that Khan, who in his last ODI batted at number nine, is listed as an all-rounder. His batting average says he is, yet his strike rate and boundary hitting say otherwise. Time will tell.
What have we learned? Five teams at this tournament had successful front line bowlers. The teams contesting the final on Sunday could also rely on their all rounders getting wickets; that sets England and New Zealand apart from the others.