Pace bowlers struggle in back-to-back Tests; Pope Catholic.

No sensational claims today – just quantifying what you already know. Bowling pace across two Tests in quick succession makes a player tired and less effective.

I took all match performances this century, comparing data against the next game that player bowled in. Then cut the data by the number of days between games. For instance, in this England vs West Indies series, the first game started on 8th July, the second on the 16th July – eight days apart. Any gap of nine days or under between start dates, to me, is “back-to-back” (BTB).

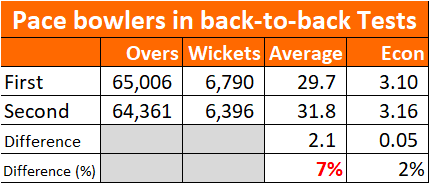
What did I find? Pace bowlers in the second of a pair of back to back Tests average 7% more than in the first game.

With more number crunching we can get closer to understanding why this happens:

•            Are there more long hops, driving up averages as bowlers leak runs? No – Economy rates don’t significantly rise.

•            More fielding errors? No – there’s no effect on spinners – so it’s probably not fielding causing it.

•            Pace bowlers must just be less potent when tired. Interestingly, at higher workloads the effect is bigger – pace bowlers bowling over 40 overs in each match of BTB Tests add 8% to their average in the 2nd Test.

Conclusion: this is significant – I’m adding it as an input to my Test match model. Front line pace bowlers add 3.5% to their average if a quick turnaround from the last Test. This rises to 4% if they bowled over 40 overs in the prior Test. Reduce expected average by 3.5% if this match isn’t BTB.

In case you’re wondering why it’s only 3.5%, and not the 7% I quoted earlier, during the first BTB Test, the bowler will be well rested, so 3.5% better than usual. The second Test they’ll expect to be 3.5% worse than usual, giving a 7% gap between performances.

PS. We finally have a mechanism for why home advantage gets bigger as a series goes on – hosts have a huge player pool to draw from, tourists are drained by practice matches.

PPS. This nugget of trivia will make you feel tired just reading it: 38 year old Courtney Walsh delivered a mammoth 128 overs across two BTB Tests in March 2001. It was six months after Ambrose retired, so Walsh was asked the impossible. West Indies lost the series 2-1. To his credit, he took 9-216 across the two games. Understandably, he almost immediately retired from Tests.

Implications for the July 2020 England vs West Indies series

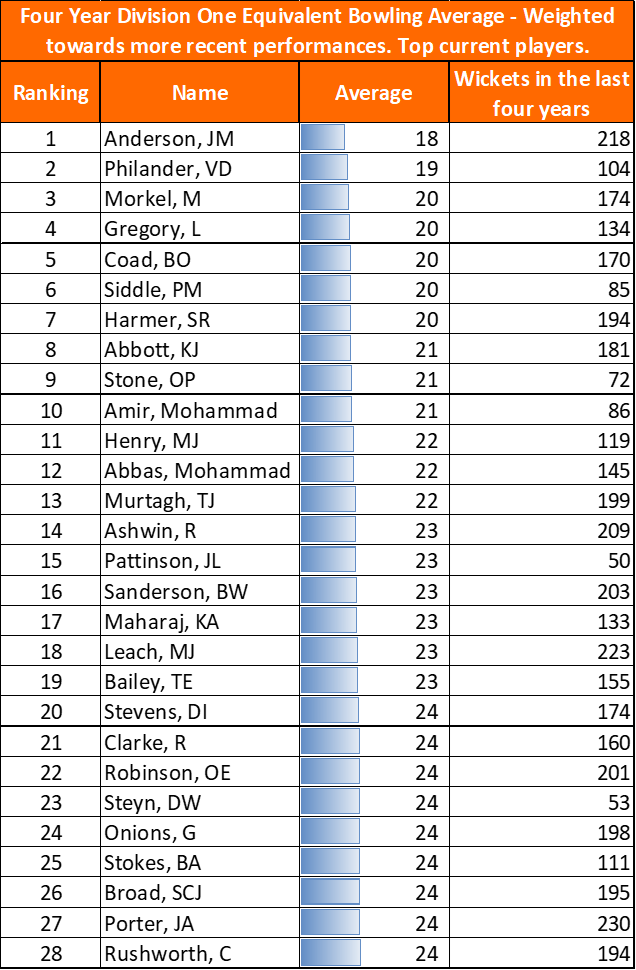
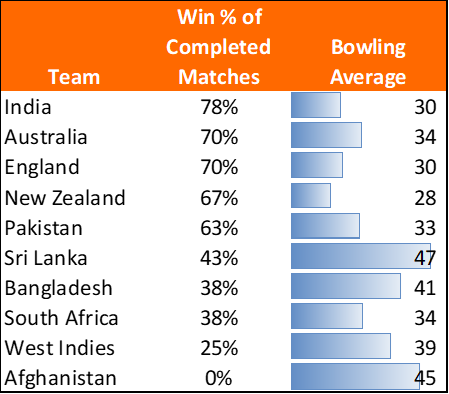
While for most participants the sample size is too small, England’s veterans have kindly left a trail of data over the years: Anderson averages 25 in non BTB, 27 in the second Test of BTB. Broad averages 27 in non BTB, 29 in second Test of BTB (bear this in mind if Broad is picked for the third Test).

Notes:

•            Third Test is back-to-back-to-back – WI will be out on their feet unless some of Raymon Reifer, Rahkeem Cornwall, Chemar Holder get rotated in. Expect Cornwall & one other.

•            What the heck were West Indies thinking fielding first at Old Trafford? The betting markets thought it was a mistake at the time. If they’d planned to field first, why didn’t they bring a fresh bowler into the team?

Bowlers: Things Change

Writing last week about the careers of batsmen and the predictive power of their early performances, I glossed over something important. Batsmen don’t get magically better as they play more Tests.* Which supports my hypothesis that there is no benefit in giving a batsman experience at Test level. A batsman has a level of ability, which is revealed in Test Cricket as they play more games. It’s thus easy to model a batsman’s expected scores.**

What about bowlers?

Fig 1- Average after 25 wickets (x-axis) plotted against rest of career average for the 50 highest wicket taking Test bowlers since 2000

Noisy, as expected. This is (on average) after only seven Tests. Let’s skip forward to when they have 100 wickets:

With 100 wickets players are well into their careers – yet there’s still no consistent pattern. I’m going to split these 50 players into two groups now: the main sequence, who behave nicely and whose past performance is a good guide to future success, and the others.

Here’s the 32 well behaved players:

For two thirds of the players, once they have 100 wickets their future is neatly mapped out, and you can approximate that they’ll play at that level until they get dropped. What about the others?

Let’s reveal who these miscreants are. Amazing how career averages can gloss over being rubbish to start with (Flintoff) or how the mighty fell (Harmison).

Fig 5 – Outliers – bowlers whose first 100 wickets this century were not predictive of future performance. “Wickets” and “Career” columns refer to post-2000 only.

Test career average is no good to measure these players. And they make up one third of the bowlers I’ve looked at. Crumbs, my models have been wrong all this time to use Test career average to measure current skill levels.

What causes this? Many possibilities: injury; being a late bloomer; switching from batting all rounder to bowling all rounder; getting “found out” as opponents learn your varieties and batsmen adapt.

How can we identify these players in advance? How do you know for sure who is now better or worse than their career average? With a spreadsheet, you won’t know. That’s a problem for me, because that’s all I’ve got. If you can read technique and separate the irrelevant detail from the significant change, then maybe. Perhaps there should be a “days since last ran” metric, like in horse racing, and anyone returning from a long layoff should be treated as a different player.

If we can’t identify the outliers, how can we rank every player accurately with one methodology? The good news – unlike batsmen, bowlers yield more data per match because they take lots of wickets per game. Whereas for a batsman we would use Difficulty-Adjusted-Career-Average, for a bowler we can use Difficulty-Adjusted-Last-Four-Year-Average, or similar.

Here’s the predictive power of more recent data. It may not look much better to the eye, but mathematically this is a better fit:

Fig 6 – Bowling averages for players with >100 red ball wickets in 2016-18 and >30 County Championship wickets in 2019. A strong correlation given the limited test period (2019 being only 14 matches maximum).

What have we learned? We should predict bowling performances based on what they have achieved recently – because for about a third of players their career average has limited predictive power. That means my model should pick up last four year performances, if too little data it should instead use career records.

* The line of best fit when plotting past vs future averages is a straight line that almost passes through zero.

**You also need to adjust for the age curve – batsmen get better as they get older, then drop off in their mid thirties. Also there will be the odd outlier (Ramprakash and Hick, for example, never made it at Test level), though examples of players with abnormal records after 50 Tests are likely to be rare.

Bowling: All County Cricketers rated

This page contains expected County Championship Division One bowling averages for all County Cricketers to have i) played during 2019; and ii) taken more than 20 wickets since 2016.

Performances in the Second Eleven Championship, County Championship and Test Cricket are included, though each performance is weighted according to the level being played at (so averaging 30 in Test Cricket is much better than averaging 40 in the Second Eleven Championship).

To give a better indication of current ability, and to partly adjust for age, ratings are weighted more heavily towards recent performances.

Ratings are shown if each player were playing in Division One – this ensures bowlers are compared on an apples-to-apples basis.

I’ll update this page periodically, as more games are played and more information is available on each player.

This version includes matches up to 23rd August 2019. For an update, see the 2021 County Championship preview, which contains much more information about each player.

If you’d like to discuss, please feel free to contact me on twitter @edmundbayliss or use the contact page on this site.

Best bowlers:

Full list:

A review of England’s bowling options

When England fans are nervous, hits to my summary of their Test batting options spike. This is the companion piece for bowling, allowing me to monitor a nation’s worries about replacements for Broad and Anderson.

We’ll start by looking at how performances since 2016 translate to expected Test averages, then discuss the implications of that.

Here’s my view of the expected batting and bowling averages of the leading contenders:

Fig 1- Expected Test averages of England’s leading bowlers, based on data since 2016. Note the reversed x-axis: an ideal player would be in the top-right, a weaker player bottom-left. Anderson stands head and shoulders above the other bowling options. For the second and third Ashes Tests, the attack of Broad, Archer, Leach, Woakes, Stokes is pleasing in that all five bowlers are from the best eleven available.
Fig 2 – England’s bowling options – those with expected average below 30 and selected others.
Note that Archer’s white ball record implies he will be more successful than recent red ball data indicates.
County Cricket performances won’t necessarily translate to Test Cricket – where pitches are flatter and games aren’t played in April/May/September in England. Stevens probably wouldn’t average 30 in Tests, but one should start with the data and adjust rather than the other way around.

Discussion

1. Older players & Succession

Five of the top 17 players are aged over 33. That means England need clear succession plans. Conversely, it also suggests Woakes and Broad might have more Tests in them than we think: Stevens, Anderson and Clarke have not diminished with age.

2. Ben Coad

Coad has consistently performed well in Division 1 for Yorkshire. Last three years: 50 wickets at 21 (2017), 48 wickets at 16 (2018), 36 wickets at 25 (2019). You know how Simon Harmer has been tearing up Division 1 and winning games for Essex? He has 156 wickets at 20 since 2016; comparable with Coad’s 135 wickets at 21.

It was a surprise that Coad came out so much better than all other bowlers bar Anderson. Consistency is key – for instance Broad and Woakes had a bad year in 2017 (averaging 36 and 51 in Tests respectively).

The next red ball Lions activity should feature Coad. It’s astonishing that he hasn’t played yet. England weren’t far off with the Lions attack of S.Curran, Gregory, Robinson, Leach, Porter- but they’ve got to find a way to look at Coad.

3. Division 2: Ben Sanderson and Ryan Higgins

I’d like to see Gloucestershire and Northamptonshire get promoted to Division 1, mainly as the neatest way to get these two playing the best standard of Cricket available. There’s a significant leap in standard between Division 2 and Test Cricket, so without ball-by-ball data it’s hard to be sure how good Sanderson and Higgins are.

If Gloucestershire don’t get promoted this year, I wonder if someone will have a quiet word with Mr Higgins and suggest he seek a Division 1 employer. Higgins is very good. I wrote about him here.

Sanderson is the wrong side of 30, so if he were to get a Test callup it would be following a lot of injuries to younger alternatives. Like James Hildreth he’ll be someone who could have made the step up from Under 19s to the full England side, but never got the chance.

4. Spin options

There’s only one viable spinner- Jack Leach. Even adjusting for the advantage he gets from playing at Taunton, he’s the best England have got. His batting’s not great, so in non-spinning conditions England should consider a batting all rounder instead. Maybe that’s harsh on Moeen Ali, but I think the “most wickets for England in the last 12 months” statistic flatters Ali – taking the longer view, his Test bowling average of 37 is nothing much to shout about.

5. Replacements

If Woakes or Stokes were unavailable: Gregory or Higgins are the best batting bowlers on the list, capable of slotting in at number eight.

If Broad or Archer were injured (and Anderson still out), Coad would be the logical replacement.

I don’t see Sam Curran as being ready for Test Cricket. His bowling average of 30 flatters him when his first class average is 29: expect it to go up if he plays more Tests. He’s only 21 – for now there are better bowlers out there.

Post-script: Methodology

To calculate expected Test averages, I took performances over the last three-and-a-half years in Second XI, County Championship, and Test Cricket adjusted for the relative difficulty of playing at each level.

I’m aware of two extra elements to add: weighting towards more recent performances and adjusting for age (young players should be getting better). These will take time to calculate, so will have to wait for the Autumn.

There’s a third factor I’d like to look at – the link between ODI and Test performance. Since not all players will perform equally well in red and white ball Cricket, I’m at present unsure how I’d quantify such a measure (eg. X averages 26 in ODIs, therefore is expected to average 32 bowling in Test Cricket).

Further reading

Wisden tipping Coad for greater things: https://www.wisden.com/stories/county-cricket/ben-coad-yorkshires-late-bloomer-englands-potential-wildcard – no doubt I’m not the first to notice that Coad is rather good.

World Cup Bowling: Postmortem

Admittedly there’s a game to go, so this is a mid-mortem of how bowling has driven success.

Today (11th July), Australia’s fifth bowler was a combination of Steve Smith and Marcus Stoinis. Joint figures of 3-0-34-0 did not help their team’s cause when trying to defend 223. A canny side would try to pick off the ten overs Australia have to find from their weaker bowlers. Are the Australians particularly vulnerable here?

How effectively have the all-rounders bowled in the 2019 Cricket World Cup, and what can we learn from this?

All rounders – aggregate bowling performances at the 2019 Cricket World Cup. Sorted by bowling average. England and New Zealand players highlighted. Note the scarcity of averages under 35.

Bear in mind that the average runs per wicket across the tournament was 33.5, most all rounders under-performed the average by at least 10%.

Now to assess Cricket World Cup 2019 bowling on a country by country basis:

CWC 2019 bowling records split by Bowlers and All Rounders, by country. Note the core bowling units all average between 24 and 30. Averages for all rounders are higher, while Australia’s all rounders are an outlier: averaging 50 at an economy rate of 6.2.

Firstly, the semi-finalists.

Australia struggled with their fifth bowler through the World Cup. Maxwell bowled 49 wicketless overs, and all five all rounders went for over a run a ball. Combine that with the weakness in the number eight batting slot, and you can see why expectations for Australia were low coming into the tournament.

Given Starc’s relentless 27 wickets at 19, it was surprising that Australia’s front line bowlers averaged as much as 30 with the ball – Lyon/Coulter-Nile/Zampa conceded 697 to pick up just 12 wickets. This attack was the weakest performing of the four semi-finalists, which makes it incredible that they won 70% of their matches. Well batted Warner and Finch.

There’s a tight grouping for New Zealand, India and England. If India have a weakness it was that Hardik Pandya’s bowling averaged 45 over nine matches. With a career average of 41, that puts pressure onto the rest of the attack. Taken individually, a spell like 10-0-55-1 (his semi-final performance) is disappointing but acceptable. However India’s problem is that that’s near his average, and opponents can expect low risk runs. If India had a stronger fifth bowler New Zealand may not have accrued 239 runs.

Of course selectors have to balance batting and bowling – it’s just that England have Stokes and Woakes so don’t really need to concern themselves with that conundrum. Similarly, New Zealand have Neesham and Williamson.

Next we look at the sides that didn’t make it to the semis:

CWC 2019 bowling records split by Bowlers and All Rounders, by country – teams eliminated at the group stage only. Circles represent front line bowlers, crosses are all rounders.

Funny how a cold look at the data changes your perspective. I hadn’t realised all of Sri Lanka, Afghanistan, Bangladesh and West Indies averaged over 39 with the ball. Little wonder their collective record was W8 – L29: if you let a team get to 150-3, they’ll bat you out of the game.

A word on Shakib Al Hasan – his bowling figures don’t stand out (he ended with 11 wickets at 36). His batting more than made up for it though (606 runs at 87). A great combination of fantastic batting and sending down more than nine overs each innings.

It wasn’t the bowling that let South Africa down. The need to find replacements for Amla and Duminy is pressing.

Pakistan have the greatest discrepancy between the specialist bowlers and the all-rounders. Shadab Khan (tournament figures 2-188) and Imad Wasim (2-189) repeatedly let teams off the hook. Some may be surprised that Khan, who in his last ODI batted at number nine, is listed as an all-rounder. His batting average says he is, yet his strike rate and boundary hitting say otherwise. Time will tell.

What have we learned? Five teams at this tournament had successful front line bowlers. The teams contesting the final on Sunday could also rely on their all rounders getting wickets; that sets England and New Zealand apart from the others.

Bowling averages at the 2019 Cricket World Cup correlated with winning rates

England aren’t picking bowlers based on First Class performances

Looking at 2016-2018 Test, County Championship and Second XI bowling data, and adjusting for the relative quality of that Cricket, we can rank the England qualified players.

I’ll use this for a 2019 preview a bit closer to the start of the season.

In the meantime, here’s a look at England selection. Given that County Cricket mainly takes place in April, May, August and September, it doesn’t necessarily replicate the conditions for home Tests in mid-summer (let alone away games).

2016-2018 Bowling records, selected England bowlers. Ranking amongst England qualified bowlers, 45+ Wickets.

It’s surprising just how far down the list Wood, Curran, Rashid and Ali are. While it’s hard to find good English spinners, the case for picking Wood and Curran (77 D1 Wickets at 33) is weaker.

There’s also support for Stokes taking on a greater share of the bowling, just as he did in the West Indies (sending down 29 overs per game).