On the use of unfamiliar bowlers

England just whitewashed Pakistan away from home. Two innings of spin played a major part.

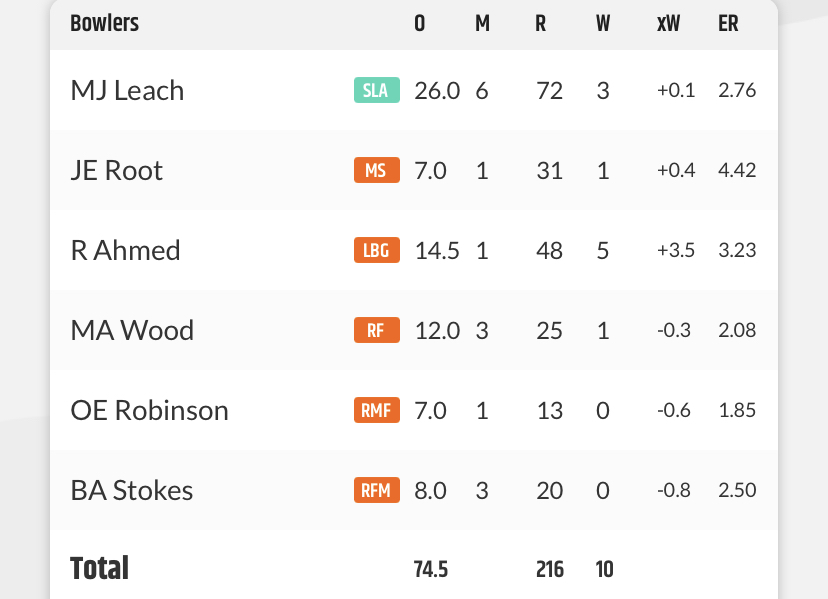
First Test: debutant Will Jacks took six wickets, outperforming xW by 2.5*. Third Test: debutant Rehan Ahmed took five second innings wickets for 48, outperforming xW by 3.5 (ie. on average it was really a 1-point-five for).

Jacks’ performance was on a surface where at one point 882 runs had been scored for the loss of ten wickets. Jacks has only bowled 411 first class overs, and 46 of them were at Rawalpindi.

I have a theory: unfamiliar spinners get a boost, relative to bowlers whose variations have been publicly scrutinised in HD. The boost is measurable by the outperformance vs xW (ie getting more wickets than you’d expect given the quality of balls bowled). We can’t test this directly (I don’t have the data, plus it’s subjective to know who is “unfamiliar”). But we can test a proxy: performances on debut.

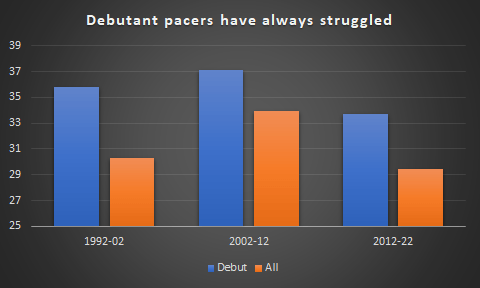
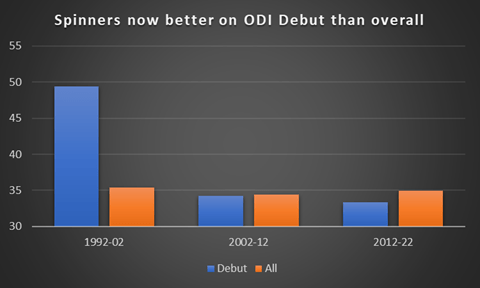
The first two columns of the below chart show how it used to be. Lots of promising bowlers get a chance, very few succeed. Most wickets are take by the best bowlers (Murali & Warne) at a low average. These days that trend has reversed.

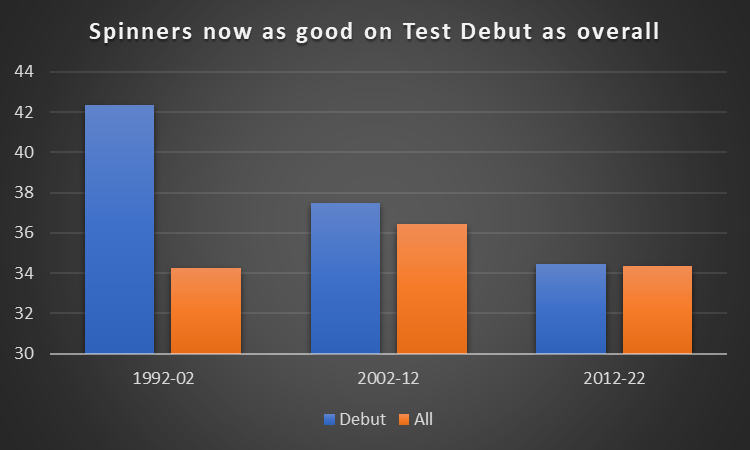
What’s driving that? I’d suggest it’s the element of mystery – spinners come in many forms, and each has a subtly different style and (possibly) variations. In the 1990s a top bowler may have been able to surprise batsmen with old tricks. Little chance of that these days. Already we know Rehan Ahmed bowls with a high arm, his leg break doesn’t turn as much as the googly, both deliveries have a scrabled seam with lots of topspin. And that’s just from one game.

There are probably some secondary factors, such as better selection, more judicious use of a second spinner, and fewer stars around to bring down the average of non-debutants.

If unfamiliar spinners have an advantage, there is an incentive to give the old ball to any vaguely capable new Test batsman. Keep an eye out for it in future, especially with England.

Take from this that one swallow does not a summer make. Give a spinner a few games to see what he’s made of**. Then we’ll decide if you’ve found the next Swann.

*I think. Didn’t write it down and Cricviz take stats off the app sharpish these days.

** Note the deliberate use of “he” – these stats aren’t based on the women’s game; so it would be inaccurate for me to assume the same principles apply.

Appendices

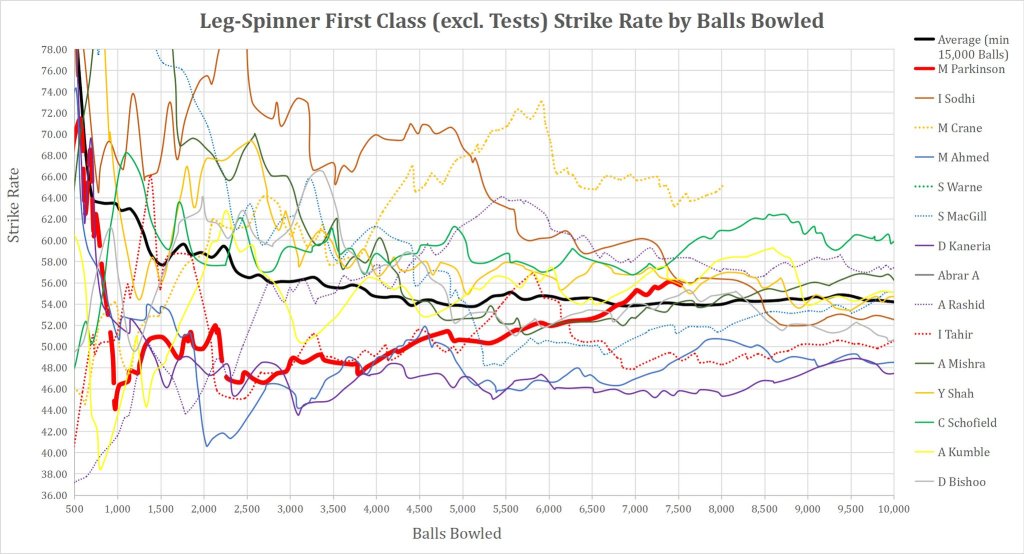
  1. Leg spinners get better as their careers go on (courtesy of @sanderson_club). Rule of thumb: takes 700 overs to reach their peak.

2. Rehan Ahmed xW – scraped from CricViz’s app.

3. ODI Spin Debutants – Note how wide the gap used to be between debutants and all spinners in ODIs. Just like in Tests.

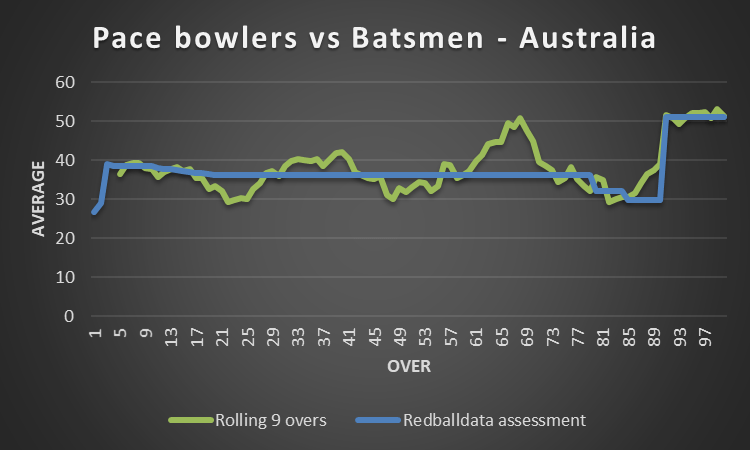
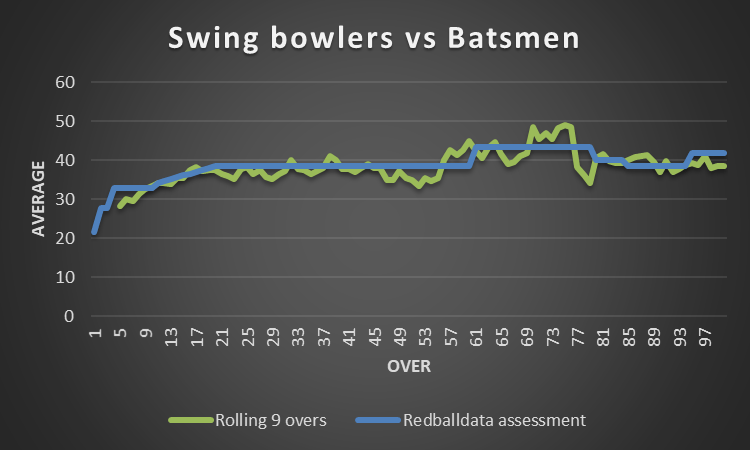
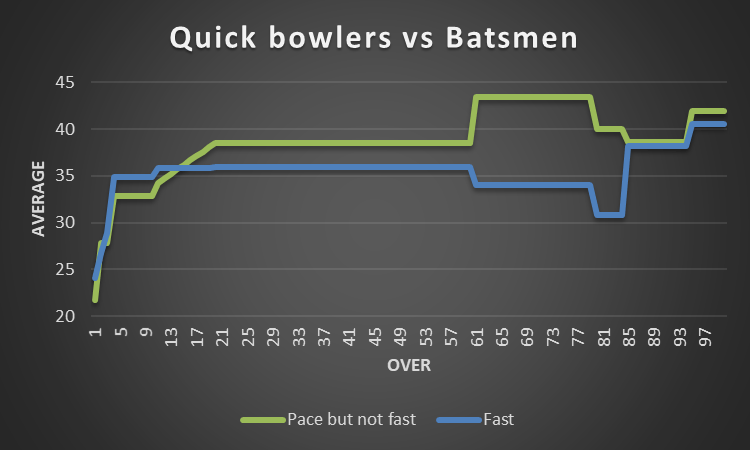
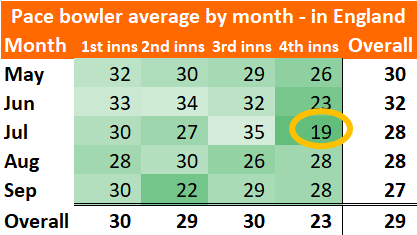
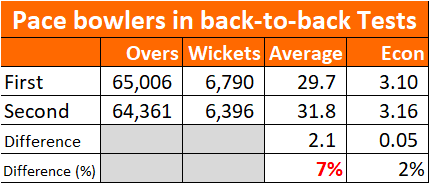
4. The same trend does not apply for pace bowlers

England’s use of bowlers in the first innings at Rawalpindi (1/12/22)

England’s spinners just took 8-405 within a total of 657. Pace bowlers only sent down a third of the overs: 50 across three days. A guy with 21 first class wickets at 53 bowled as much as the opening bowlers combined. So what happened, any why?

Anderson got 3 overs with each new ball, then three or four overs with a 30 over old ball. Just 16 of the first 120 overs. No doubt one eye on the second innings, and one on the Test starting on the 9th. I presume he would have bowled more had he had more success (22-4-52-1). Seems that England used short bursts to explore if Anderson would have favourable conditions (with new or old ball). He didn’t.

Stokes similarly got 3 overs with a 40 over old ball, then with the second new ball had a go slightly earlier with a 24 over old ball. That wasn’t what I’d expected – but Stokes averages over 40 with the new ball, so credit to Stokes’ England for giving new(ish) ball duties to the spinners.

Robinson had eight overs with new balls, then only 13 overs at other stages in the innings. He bowled so little that I didn’t see much of it, and can’t really comment.

Expect Mark Wood to return to the side for the second Test, in place of Liam Livingstone (knee injury). I see two reasons why Robinson didn’t bowl more: either rest bacause he’ll play the second Test ahead of Jamie Overton, or he looked so ineffective his overs were given to the part time spinner.

Will Jacks wasn’t someone I thought we’d see bowling much. 21 wickets at 53 in First Class cricket, and just as significantly he has bowled fewer than nine overs per game.

  • He made a good start – exerting control over the top four (1-76 at 3.3 rpo).
  • Babar Azam counter attacked, scoring at 7.4rpo before Jacks got him caught at point – a win for Will Jacks
  • Then 4-37 against numbers seven to eleven. Admittedly only two wickets were against the top order, but a good return (6-161) from a sixth bowler.

Imam ul Haq received more than half his balls from Jack Leach, making 54 before being dismissed. Not clear that England got their matchup right there if that was pre-planned.

So I can sort of understand England’s approach, and they may yet win. But when the opposition make 579 and you’re conserving bowlers because there are 15 days of Test cricket in 21, then maybe the scheduling is having unintended consequences that devalue the sport.

Don’t give fast bowlers the new ball so often

Analysing the effectiveness of bowlers with the old ball, I think Fast bowlers should be used sparingly with the new ball, which should mainly be in the hands of swing/seam bowlers.

I was looking at the impact of the new ball in Tests, and how it varies by country*. The general trend is that once the ball is 20 odd overs old the pace bowlers get little help. But then Australia bucked the trend.

Enigmatic Australia. I couldn’t find a new ball benefit for pace bowlers, other than the first three overs.

Fig 1: Pace bowler average against batsmen that average over 30, since 2005, in Australia. Note that the green line is a nine-over-rolling average, while the blue line is how I see the trend.

If you knew nothing of cricket, and just went by the chart, you’d say overs 6-20 (average 37) are as hard to bowl in as any of the first 60 overs.

Why isn’t the new ball helping the bowlers in Australia? I think it’s because selectors pick fast bowlers who are best suited to the quick and bouncy wickets. Think Steven Finn rather than Chris Woakes. “Fast” bowlers are more consistent through an innings than other pace bowlers**. Here’s the performances of fast bowlers*** in all countries:

Fig 2: Fast bowler average against batsmen that average over 30, since 2005. All countries.

Figures 1 and 2 are very similar! Averages by over in Australia look just like those of fast bowlers generally. The pitches in Australia encourage fast bowling, so the graphs are basically the same. Putting it another way, the new ball effect looks small in Australia because most bowlers don’t rely on the new ball.

What about pace (not fast) bowlers? Contrastingly, they are deadly with a brand new ball, dangerous until the 20th over, but then rather ineffective – especially overs 60-80.

Fig 3: Pace (excl Fast) bowler average against batsmen that average over 30, since 2005

Pace bowlers are not a homogeneous group. From now on, my model won’t just look at spin vs pace, it will split pace bowlers into “fast” and “not fast”. The “fast” bowlers don’t need the new ball, but do get an edge in the first five overs as the batsmen aren’t set. Other pace bowlers get a boost through the first 20 overs.

Who should bowl and when?

A big question. The fielding team’s goal is to minimise the expected runs of the batting team. That means managing resources – 68% of innings last over 70 overs, so four bowlers are going to at least three spells. When should those spells be?

There’s a point in the innings when a fast bowler becomes more effective than a swing bowler. It depends on the ground, the relative quality of bowlers, and the weather.

On an average pitch, the crossover is in the fifteenth over. If you had an equally talented attack of three swing bowlers and one fast bowler, the fast bowler should be held back until after the crossover, and bowl as much as possible with the old ball.

The trend of the above charts (since 2005) still holds true: current Fast bowlers average 4% more in overs 20-80 compared to overs 1-19. The equivalent figure for other pace bowlers is a whopping 19%****. You don’t want to make Medium-Fast / Fast-Medium bowlers use and old ball.

Please forgive the absolutes above. Of course, there’s no sudden leap between “Fast” and “Fast Medium” bowlers. And if the old ball is reversing then by all means pass it to the swing bowler.

But – I think this kind of analysis is important. It’s only by codifying and quantifying we can get closer to understanding the game. The assumptions and simplifications can be ironed out later.

What’s next? Once someone (maybe me, maybe you) has the data on how spell length impacts performance, and a reliable way of combining specific (head-to-head) and general matchups (eg. OS vs LHB), we’ll have a model for the optimum bowler for the next over. From there it’s a small step to planning optimum bowlers for the next session.

Footnotes

*Methodology: Pace bowlers (career average under 35) against batsmen (career average over 30). That way we’re avoiding the effect of cheap wickets at the end of the innings, and just looking at the real contest between bat and ball. All my ball-by-ball data comes from cricsheet.org.

** Fast bowlers should be about as quick later in the day. Two bits of evidence for this- firstly the academic research implies it (link and link). Secondly the speed data for Jasprit Bumrah and Olly Stone from India v England, 2021.

Data from India vs England 2021, screengrabs from the BCCI website

And, because it’s interesting I’ll give you two more footnotes to this footnote:

  1. According to this there is a speed decrease of around 4kph from bowling in heat on consecutive days
  2. Jofra Archer had a tendency to decrease in speed through the innings in India. He might not be like other fast bowlers. That’s not necessarily a criticism – being able to switch from RF to RFM might allow him to bowl more overs.

***Note this is 20 Fast bowlers, among the leading wicket takers of the last 20 years. Not quite the top 20, as I tried not to have too many from one country (Australia).

****Based on cricinfo’s classification of bowlers (F, FM, MF). Only includes balls when bowling to batsmen who average over 30. The population in question are the 25 leading pace wicket takers from March 2019 – March 2021.

Country vs Country matchups in Test Cricket

It’s naive to assume that England will play as well in Mohali as they do in Melbourne.

But how to measure this? Results are misleading: a 20 run win is not as dominant as a 220 run one. Hence runs per wicket (RPW) is the best approach.

We should adjust for the relative strength of teams: Bangladesh have lost all four games in England this century – but is that purely because of the gulf in talent? If Bangladesh were as good as England, how much would they lose expect to lose by because they were playing in English conditions?

Here’s my approach: use all data since 2000 to calculate the number of runs per wicket scored by each team, and the equivalent conceded when fielding. Comparing runs per wicket when fielding to the average team gives a measure of each team’s bowling strength (eg. India’s 32 makes them 3% better than the average fielding team). New Zealand average 31 runs per wicket batting, so we would expect New Zealand to score 31 * 0.97 = 30.1 runs per wicket when playing India.

Repeating that for every pair of teams gives a set of ratios of relative strength:

Relative team strengths 2000-2020 based on runs per wicket batting and bowling. eg. Australia would expect to outscore England by 26% in a Test on neutral territory.

See where we’re going with this? Now all we need to do is compare actual relative runs per wicket when the countries play each other to get specific country vs country matchups.

Here are the actual RPW ratios when the home team (first column) plays a specific away team (first row):

Actual RPW ratios 2000-2020. For example, Australia outscored England by 45% when at home, while England were outscored by 13% when hosting Australia. Minimum 50 wickets – blanks reflect a lack of data.

Let’s take stock. When Australia host West Indies they’ve dominated them – scoring 2.09 runs for every run scored by West Indies. Most of this can be explained by Australia being 73% better than West Indies. The remainder is from conditions and player-on-player matchups. Even if West Indies were able to field a team as strong as Australia, they would still be outscored by 2.09 / 1.73 = 1.21 times (or 21%) playing in Australia.

That 21% happens to be the average Home Advantage over the last 20 years. For the penultimate table, I’ll take the ratio of the first two tables, and adjust for the “normal” 21% home advantage to be left with specific additional adjustment factors for when two teams play each other.

This is noisy- reds and greens everywhere. Time for some judgement: I don’t think one can rely on the data for pairs of countries, because for some pairs of teams there just aren’t enough games. Instead I’ve grouped teams to pick up bigger trends.

Findings

  1. India & Australia get an average 27% home advantage (for most teams it’s 21%)
  2. Asian teams in SENA (South Africa, England, New Zealand, Australia) countries do on average 10% worse than expected.
  3. Sri Lanka don’t travel well

Based on that, here’s an adjusted version:

Home advantage (%) for specific pairs of teams – after adjustments made by me. For example, Australia get a 25% boost hosting Bangladesh

This analysis is crude. I’m not totally persuaded by it (yet). Such as why are New Zealand terrible in South Africa, when crudely similar teams like Australia and England do well there? Would we expect that trend to continue? Is it too reductive to assign characteristics to nations rather than specific players?* Perhaps, but if it helps understand why teams are winning then I’ll use it.

For instance, South Africa have a habit of beating England in England. This could be because conditions are similar in the two countries, so England lack their usual home advantage.

I’ll keep an eye on this in 2021. The four remaining series in 2020/21 are all fairly normal for home advantage. Relevant to the World Test Championship final, it’s worth noting the raw data for India and Pakistan in England hints that the location of the final suits Pakistan more than India.

Another good test for this approach will be India touring England next summer. Is this Indian team (armed with Bumrah), sufficiently talented in the pace department to avenge the 4-1 defeat from 2018? If so, that will hint that Team A being forever doomed touring Team B is twaddle.

*There’s a part of me that finds this analysis distasteful too – assigning characteristics to a whole nation.

DRS: The story so far

As the internet matures, the amount of freely available data has reduced. So I was excited when this popped up on twitter:

A chance to examine some of the received wisdom on the review system. I’ve got five myths and three trends to share with you.

Before we get into that, a summary. Over the decade of Decision Reviews, most reviews have been by the fielding team (57%). However, batsmen have had greater success overturning dismissals (35%, compared to 21% for the fielding team). The 907 overturned decisions are 6% of the wickets over the last decade, so while umpires are getting the overwhelming majority of decisions right, DRS is making a noticable difference to the accuracy of umpiring.

On with the show. Firstly, five myths:

I’m going to have to ask you to reverse your opinions

Myth 1 – Umpires favour the home team

Crunching the numbers, the hosts and visitors have uncovered almost exactly the same number of incorrect and borderline decisions. In terms of overturned decisions it’s 416-413 in favour of the home team, while the marginal decisions that haven’t been overturned (“Umpire’s Call”) have benefitted the home team slightly, with 109 reviews by the visitors being adjusted Umpire’s Call, against 100 for the home team.

If umpires were being influenced by the crowd, there would be more decisions against the away team then being overturned – this isn’t happening, so whatever home advantage is in Cricket, it’s not from umpires.

Myth 2 – Having a decision overturned gets into an umpire’s head

I took each example of an umpire who had a decision overturned, and looked at the next DRS review for that umpire on the same day in the same innings. If umpires were trying (even subconsciously) to even things up, you’d expect the umpire to give the next close one out, which the batsman would review. Putting this in terms of data, we’d look for a decision overturned against team A to be followed by a review by team B.

No evidence for this exists – of the 449 times when a decision was overturned and another review occurred on the same day, same innings, same umpire, 235 were the other side reviewing, 214 the same side. Umpires are considering each ball on its merits.

Myth 3 – Teams use reviews “just for the sake of it”

This one really surprised me. I’d expected to need to cleanse the data of the pointless reviews at the end of an innings when there’s no harm in reviewing. So I looked for those pointless reviews, but they don’t exist.

Opportunistic reviews should be visible by a dire success rate. Here’s the split of success rate by the batsman’s average:

Maybe a handful of spurious reviews from the worst batsmen, but they aren’t taking the mickey.

Myth 4 – Some teams are better at DRS than others

Not true – all the teams are very tightly bunched. I’ve excluded Afghanistan (30%), Ireland (50%) and Zimbabwe (30%) as they just haven’t played enough.

Myth 5 – Some umpires like to give things out and some like to say “not out”

There are two ways this would manifest itself for Outers: “Umpire’s Call” would tend to be batsmen reviewing balls, clipping the stumps, that were given out; and the proportion of successful reviews would be higher for batsmen.

Because of the small sample sizes, it looks like there are trends, but when you put the two methodologies side by side, the pattern disappears. Which is a shame, because I’d hoped that the umpires who were bowlers would be Outers and those that were batsmen would be Not Outers. Turns out Elite Umpires are just professionals. Here’s the chart for good measure.

Now for the true trends

Stay with your original opinions; you’re on screen now.

Trend 1 – Quality of reviews drops by day

Tony Corke (@matterofstats) got in before me with this trend – here’s the chart he produced

Trend 2 – Resetting reviews after 80 overs (2013-17 rules) reduced review effectiveness

The long term trend is fairly consistent – flitting around the 27% mark. Except for 2014 and 2015. I think I can explain that dip.

In 2013 a rule was brought in whereby reviews reset after 80 overs. This was to avoid punishing a team who lost reviews to marginal decisions. A better rule took over from autumn 2017 – “Umpire’s Call” decisions would not cost a review.

The impact of the resetting reviews was felt in overs 60-80: teams were in a position of “use it or lose it”, so did the logical thing and reviewed liberally. Thus, from 2013-16 the success rate in overs 60-80 was only 20%, having been 28% for those overs before 2013. Naturally, once the new rules took over from 2017, the success rate for overs 60-80 returned to 28%.

Trend 3 – DRS success rates differ by ground

The harder batting conditions are, the better the relative performance of fielding reviews versus batting reviews. Any scatter plot for this looks ugly, so you’ll just have to take my word for it that this is a statistically significant correlation. In lieu of that, here’s a chart of batting and bowling DRS success rates by ground.

Now, I’m not sure which way the causation runs. One possibility is that at high scoring grounds the umpires get lulled into thinking batsmen aren’t going to get out, so they don’t believe their eyes when a batsman is out.

The key point I’d like you to take from this is just how consistent umpires are.

Top innings bowler in Tests

Cricket has quirks. Look at it through another lens; learn something new. Today’s angle is wicket-taking. What kinds of bowlers are the leading wicket takers in a particular innings, and what implications does that have?

Since 2010. First five bowlers used only

No surprises here. Let’s go deeper.

Pace bowlers by innings and by position

Since 2010. First five bowlers used only

Opening bowlers are the best pace bowlers. They also get a boost in the first morning on a fresh pitch. In later innings, they are still favourites among pace bowlers (though the spinners start to get a look-in).

First change bowlers are about two-thirds as likely to be leading wicket taker in an innings. Probably two factors – they aren’t quite as good as openers, and (more significantly), they don’t get the new ball, or first crack at the tail. In later innings their chances improve, probably because those innings are shorter, squeezing out the part time bowlers.

The fourth bowler is just as good as the third, until the second half of the match. The fifth bowler gets a reasonable go in the first innings, but not much action in the second. They are surprisingly unlikely to take the most wickets in an innings – it’s kind of a four horse race.

Pace bowlers by Ground

We haven’t the data to do much by ground, but one stadium gets two Tests a year: Lord’s.

Lord’s since 2010. First five bowlers used only

There’s a 75% chance one of the two openers is leading wicket taker in the first innings at Lord’s – batting is hard in that first hour. The change bowlers don’t really get a look in.

Until models are seriously good, they won’t always beat local knowledge. To get that I need domestic stats. Must build that database at some point.

Spin bowlers by Country by innings

Never cut a spinner. Or back one to be leading wicket taker in the first innings in the SENA countries (South africa, England, New Zealand, Australia). The general trend of a gentle increase in top-wicket-taker probability from 19% in the first innings to 26% in the last is not seen worldwide. In India, Sri Lanka and Bangladesh, a front line spinner should rarely be available at longer odds than 3-1 in any innings.

(Also a reminder that spinners go from pointless to prized over the course of five days in England).

Individual players

If ye grind yer [gunpowder] too fine, it’ll blow yer bloody head off, then nobody’ll know who’s best shot; thee or me

Sharpe’s Siege

Do bowlers have preferred grounds? Almost certainly. Does it show up objectively in the data? Maybe, if you know what to look for. I’ve checked just one example: Stuart Broad. Using the data since 2010, Old Trafford was clearly his favourite ground, while The Oval was a graveyard. However, look just outside this horizon, and in Broad’s only previous Old Trafford Test he took 0-79, while in his earlier Oval Tests returned 11 wickets at 19. Regression to the mean? Maybe.

What have we learned?

Nothing earth shattering – hints at how bowling position impacts performance, a reminder that grounds can have peculiar characteristics, another reminder that the usefulness of spin through a match varies by country, and my squeamishness about small sample sizes was reinforced when looking at Broad’s record.

Call this one “knowledge consolidation” – kicking the tyres of what I think I know, and nodding approvingly at the result.

Using judgement when rating cricketers

Yesterday Zak Crawley scored 171*. 

Before the West Indies series I said “he would be a bold and wrong selection, going against the publicly available data… If he succeeds, I will give them credit.” Time for me to issue a credit to the England selectors.

Moving swiftly on, with Crawley and Ben Stokes outperforming their ratings it’s time for a rethink. There’s qualitative data I’ll start using: the judgement of others. We’re in uncharted waters; we’re Going Beyond Stats.

I appraise batsmen based on four years of data (six if they rarely play). It’s a stable method. I don’t have meaningless volatile opinions (like a certain former England captain). There are limitations though. Injuries, new techniques, changing roles can all have an effect. My ratings system is too slow (look at Bairstow – his stellar 2016 is still boosting his rating).

Adding the 171* to my database would boost Crawley’s expected Test average by three runs (going from 26 to 29). Is that enough? Is he better than that?

Rob Key previously said “Crawley is young and his numbers will improve. You just have to watch him bat to know that.” Actually I can’t: I don’t trust my eye. But if people I respect are saying a player is better than their stats, maybe there’s something in that.

With a base average of 29, your chances of 171* (in the first innings, at home, against a strong attack) are around one in 150. In other words, yesterday shouldn’t have happened. Much more likely for a player with a base average of 35 – it’s a one in 60 shot.

After a finite number of innings there is uncertainty about how good a player is. I can tell you roughly how good a player has been, give or take a bit. Luck is a factor, moreso the less data you have. Error bars give a range of possible ratings for a player, with a 95% chance their level of ability lies somewhere in that range.

Let’s jam those two concepts together to add a third step to my ratings framework:

  1. Rate player based on stats
  2. Add error bars to that rating, based on the number of dismissals.
  3. NEW: Adjust the rating within the plausible range based on the views of people you trust.

Oh, and “the views of people you trust” can include selectors. For instance, if someone had rubbish data but is batting at four, then selectors are implicitly telling us the person is better than their stats. We should use that information.

What does that mean for Crawley?

  1. Rating 29
  2. Margin of error +/- 7 (after 83 dismissals in the last three years).
  3. Boost rating by 5.0 to reflect the excitement and that England choose to bat him at three.

Crawley is now expected to average 34 in Tests. This recognises that he is probably at the upper end of the range of plausible averages (22 to 36) because he is trusted to bat at three, and is highly regarded.

I will do the same exercise with all county cricketers to redefine their red ball ratings to incorporate the role they are given. However, there are about to be several meaningless games in the Bob Willis Trophy, so that may have to wait for next year.

I’ll also do that with England’s Test batsmen. For instance, Stokes at 40 +/- 12 might be re-rated at 44 (based on two year record, and pundit judgement).

One innings doesn’t change everything, but I’ve seen enough outliers to want to try something new. Where does this leave us, now data is being tinkered with, and we lose the safety of being moored to pure stats? I draw the parallel with the astronomers maintaining the Earth as the centre of the solar system, as more data made that harder to believe. Models became contorted to fit the data, before being binned. Is that happening here? Time will tell. #OnOn.

Test bowling averages by month in England

Spinners averages are influenced by time of year and innings number. I’ve had a go at quantifying these effects, and looked at the (smaller) impact on pace bowlers. Along the way I’ll make a couple of observations on fourth innings chases.

Starting with spinners, it won’t surprise you to hear that early season English conditions are unfavourable. The first innings average for spinners before August is 59. Spinners are little use in May and June, when pitches are damper and less worn. Twirlymen are generally passengers in the first innings of a match.

Spinners since 2010, first five bowlers used. Later innings have lower averages, likewise for later in the summer.

Spin bowlers average 15% less in August/September than May/June. While spinners are generally more effective in the fourth innings, it’s July when they are matchwinners. Averaging 22, with 49 wickets (so a decent sample size). Next consider the same view but for pace bowlers:

Pace bowlers since 2010, first five bowlers used. Fourth innings has lower averages, likewise for later in the summer.

Much less variation with the seasons for quick bowlers; this graph is much greener, pace bowlers are always a good thing. Averages dropping about 10% from spring to summer. A pronounced dip in the fourth innings (23) against averaging 30 in the first three innings. The sweet spot data point, again, is that fourth innings in July.

Combining spinners and pace bowlers, over the last decade the fourth innings yields 19 runs per wicket in July, compared to 28 in other months. The reason is somewhat counter-intuitive – pitches start out best for batting in July. The higher averages in the first three innings at that time of year mean the fourth innings in July start on average 20 overs later than at other times of year. Cracks, footmarks, the works. Just 3 out of 21 fourth innings chases were successful in July. Conversely, batting last in May/June was successful 5 times out of 13: a 250 chase is achievable.

***

Here’s a handy guide for captains of when to bowl spin in England. When do spinners average less than pace? (Or “Should I bowl my spinner if I have a fresh pace bowler?”)

In England, since 2010, performances of first five bowlers used.

I’m being somewhat glib (pace is less effective with an old ball and July 31 is not magically different from August 1), but teams do get this wrong. Just because spin is most effective in the fourth innings doesn’t mean any spinner is the best option. West Indies failed to defend 191 in the fourth innings in May 2012. Marlon Samuels (off spin, part time) bowled ten overs for 51 – Fidel Edwards only got eight overs.

What about the middle overs of the fourth innings? We can have a go at “spin or pace in the fourth innings with an old ball,” by comparing outcomes for spinners to the fourth bowler used (if they are a pace bowler). On this measure spin wins with an average of 25 against 27 for the fourth bowler used. Meanwhile opening bowlers have more fun in the fourth innings in England, averaging 22.

***

When slow bowlers look ineffective (early in the summer and early in every match), that’s because they are ineffective. They are still helpful in the fourth innings, but don’t give them the new ball. Spinners are probably overused and overselected in Tests in England.

Keeping things topical: Yasir Shah (Test average 30) should seldom bowl overs that could be Mohammad Abbas’s (Test average 21).

England vs Pakistan Preview – August 2020

An impressive batting unit supported by an exciting bowling attack versus an impressive batting unit supported by an exciting bowling attack.

What will decide the series? Here’s my usual pre-series ramble, with stats on the Pakistan squad at the bottom.

  1. All rounders. England are running out fast. Debateable whether England will even have an all rounder for the first Test. Some names to mull: Ben Stokes (is he fit to bowl?), Joe Denly (dropped), Moeen Ali (dropped), Chris Woakes (struggling with the bat), Sam Curran (is he good enough at either discipline)? As for Pakistan, Shadab Khan averages 34 with the bat from five Tests, but only 27 in First Class – more a number seven than a six. Pakistan will be gambling either way: a five man attack lengthens the tail, an inexperienced four man attack has nowhere to hide.
  2. Pitch preparation. England would be stronger if they could confidently not pick a spinner (Bess didn’t contribute a lot with the ball against West Indies). Pakistan are itching to play two spinners. Why would the Old Trafford groundsman produce a deck that turns? Worth noting in the two Manchester Tests this summer, spin averaged 52 while pace was around half that at 27.
  3. Naseem Shah and Kashif Bhatti. Pakistan’s batting is solid, enough talent that they can cover if any one of them goes full Shai Hope. For all the excitement, I’m uncertain about their bowling. Mohammad Abbas is a banker (Test average 21, and the same average in two devastating seasons at Leicestershire). Shaheen Shah Afridi has 30 Test wickets, so has some track record. Yasir Shah has a proven record – it’s just a bit mediocre (averaging 34 in the last four years). One of Naseem Shah or Bhatti thus has to step up. The signs are good – both average 17 in domestic cricket in the last four years (Bhatti has 125 wickets, the younger N. Shah has only 26).
  4. Rest. West Indies clearly don’t read this blog (or The Daily Telegraph), else they wouldn’t have knackered their bowlers playing three back-to-back Tests. A three Test BTB series is more like a tournament than a traditional Test series: you’ve got to manage bowler workload. The easiest way to do that is to pick the best team for the first game, then half the pace bowlers miss the second Test, and the others miss the third. Sohail Khan is good enough to rotate in – but are the other Pakistan squad bowlers Test standard? With England’s squad depth, their edge will get bigger as the series goes on.
  5. England’s Ashes tunnel vision. Picking Crawley and Bess with an eye on December 2021 is silly. When the West Indies series got real, Crawley was dropped and Bess didn’t get a chance to bowl. Pakistan will be only too happy if England’s team sheet has a number three with a First Class average of 31, and an off spinner for Pakistan’s right handed middle order to milk. Bess isn’t a bad player, it’s just that England would have a better chance of winning playing an extra pacer.

England start as favourites. Burns, Sibley, Root, Stokes are a fine core of a batting order, and there’s healthy bowling options. If Stokes can bowl, a balanced England team playing on increasingly familiar territory should be too strong.

Get to know the Pakistan squad: Stats

Batting:
Note through this lens Babar Azam isn’t the standout batsman.
Bowling:
Note the domestic four year averages of Abbas, N.Shah and Bhatti.

Pace bowlers struggle in back-to-back Tests; Pope Catholic.

No sensational claims today – just quantifying what you already know. Bowling pace across two Tests in quick succession makes a player tired and less effective.

I took all match performances this century, comparing data against the next game that player bowled in. Then cut the data by the number of days between games. For instance, in this England vs West Indies series, the first game started on 8th July, the second on the 16th July – eight days apart. Any gap of nine days or under between start dates, to me, is “back-to-back” (BTB).

What did I find? Pace bowlers in the second of a pair of back to back Tests average 7% more than in the first game.

With more number crunching we can get closer to understanding why this happens:

•            Are there more long hops, driving up averages as bowlers leak runs? No – Economy rates don’t significantly rise.

•            More fielding errors? No – there’s no effect on spinners – so it’s probably not fielding causing it.

•            Pace bowlers must just be less potent when tired. Interestingly, at higher workloads the effect is bigger – pace bowlers bowling over 40 overs in each match of BTB Tests add 8% to their average in the 2nd Test.

Conclusion: this is significant – I’m adding it as an input to my Test match model. Front line pace bowlers add 3.5% to their average if a quick turnaround from the last Test. This rises to 4% if they bowled over 40 overs in the prior Test. Reduce expected average by 3.5% if this match isn’t BTB.

In case you’re wondering why it’s only 3.5%, and not the 7% I quoted earlier, during the first BTB Test, the bowler will be well rested, so 3.5% better than usual. The second Test they’ll expect to be 3.5% worse than usual, giving a 7% gap between performances.

PS. We finally have a mechanism for why home advantage gets bigger as a series goes on – hosts have a huge player pool to draw from, tourists are drained by practice matches.

PPS. This nugget of trivia will make you feel tired just reading it: 38 year old Courtney Walsh delivered a mammoth 128 overs across two BTB Tests in March 2001. It was six months after Ambrose retired, so Walsh was asked the impossible. West Indies lost the series 2-1. To his credit, he took 9-216 across the two games. Understandably, he almost immediately retired from Tests.

Implications for the July 2020 England vs West Indies series

While for most participants the sample size is too small, England’s veterans have kindly left a trail of data over the years: Anderson averages 25 in non BTB, 27 in the second Test of BTB. Broad averages 27 in non BTB, 29 in second Test of BTB (bear this in mind if Broad is picked for the third Test).

Notes:

•            Third Test is back-to-back-to-back – WI will be out on their feet unless some of Raymon Reifer, Rahkeem Cornwall, Chemar Holder get rotated in. Expect Cornwall & one other.

•            What the heck were West Indies thinking fielding first at Old Trafford? The betting markets thought it was a mistake at the time. If they’d planned to field first, why didn’t they bring a fresh bowler into the team?