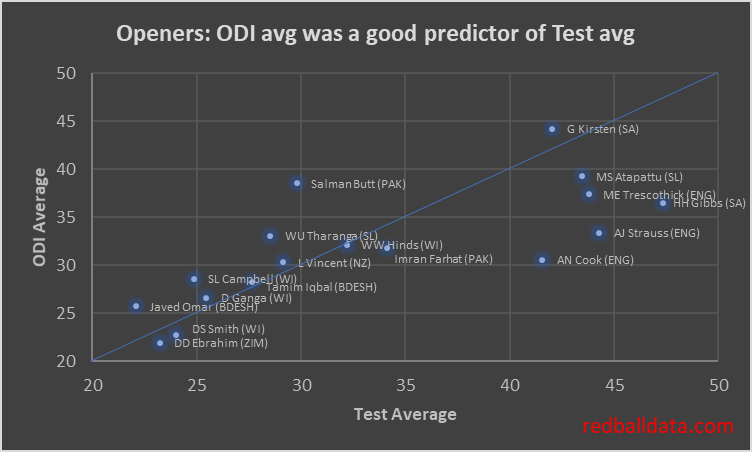
Wind the clock back. The good old days. Specifically the noughties (or 2000s, or whatever). An opening batsman fulfilled the same role in Tests or ODIs. Hence their ODI and Test averages were similar, and you could use one to predict the other with a fair degree of confidence.
Fig 1 – Averages of openers to have played >20 innings in Tests and ODIs from 2000-2009
The correlation is so good that the names get all jumbled up on the straight line running from (20,20) to (50,50). Yes, there’s some Test specialists there (Cook, Strauss) but most of the 23 players that meet the criteria for inclusion behave as expected.
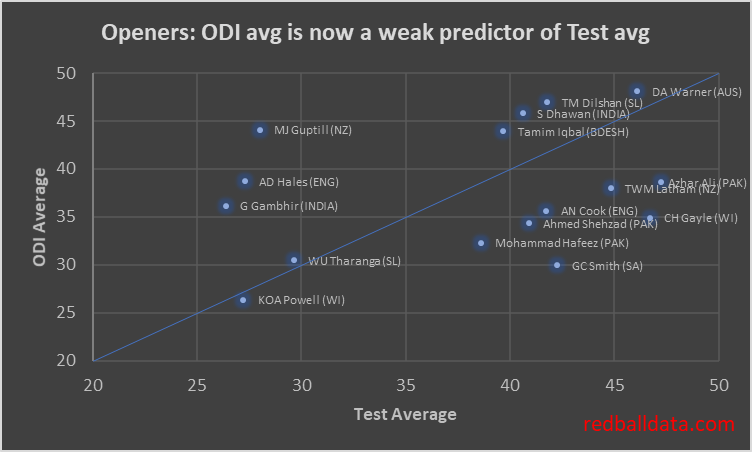
That correlation has broken down now.
Fig 2 – Averages of openers to have played >20 innings in Tests and ODIs from 2012-2019. Note the same axes as Fig 1.
There are three distinct types of player, reflected in the clustering in the chart:
Versatile elite batsmen (Warner, Iqbal) – just as good in either format, average over 40 in both.
Test specialists (Latham, Azhar Ali) – who are/were good enough to play in ODI Cricket, but averaged at least five lower in ODIs
ODI specialists (Hales, Guptill) – averaging under 30 in Tests.
I’m reminded of the film Titanic (1997) explaining the captain’s complacency: “26 years of experience working against him”. That line stuck with me – it’s easy to assume past trends will continue, and that you can use opening the batting in ODIs as a pathway into opening in Tests.
Not any more. Unless the player is good. And I mean really good, the best predictor I can see for successfully opening the batting in Tests is successfully opening the batting in red ball Cricket. Think about Jason Roy – ODI Average 43 as an opener, Test Average 19. I don’t think anyone is now expecting him to average 35 in Tests as an opener. Yet someone must have thought he could, else he wouldn’t have been picked.
redballdata.com – closing the stable door after the horse has bolted!
PS. This piece serves as another reminder to me to continually check that the trends I’ve seen still hold – else one day I could be the mug taking Fig.1 to a meeting, persuading everyone to pick the best ODI openers to open the batting in Tests.
This is a pretty basic three-card-trick, in which I’ll make the case that T20 batting has harmed Test averages.
In summary, batting techniques began to adapt earlier this decade so a T20 strike rate of 130 was low risk, then ODI batting adopted those techniques, and finally Test players became unable to adjust between three formats. It’s just one possibility, and I’m aware that correlation is not the same as causation. Don’t worry, there’s charts behind the opinions!
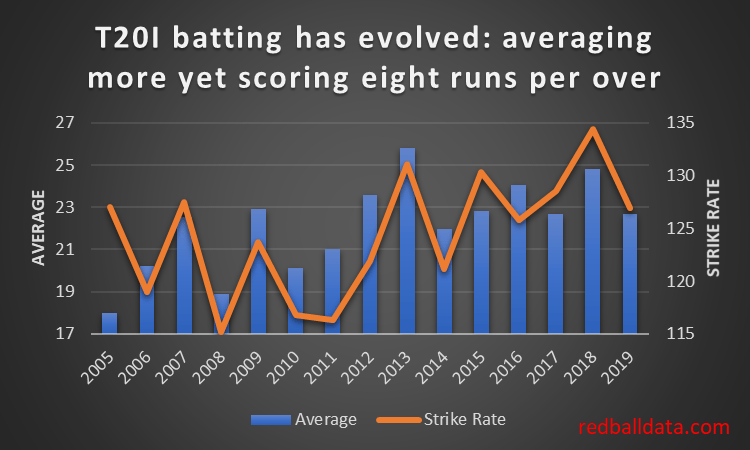
1.Evolution of T20 batting 2011 – 2018
Firstly, high-risk fast-scoring T20 batting has become lower risk. Wisden reckons it’s because teams are getting better value out of the same number of attacking shots (ie. cleaner hitting, not just playing across the line – see Kumar Sangakkara’s description in this video). A precis: “It’s never just wild swings”.
Fig 1 – Runs per wicket and Strike Rate by year in T20 International Cricket. Note how the Strike Rate in 2005 was 127, but batsmen needed to take risks to do it: averaging just 18 runs per Wicket. By 2018 that average was over a third higher.
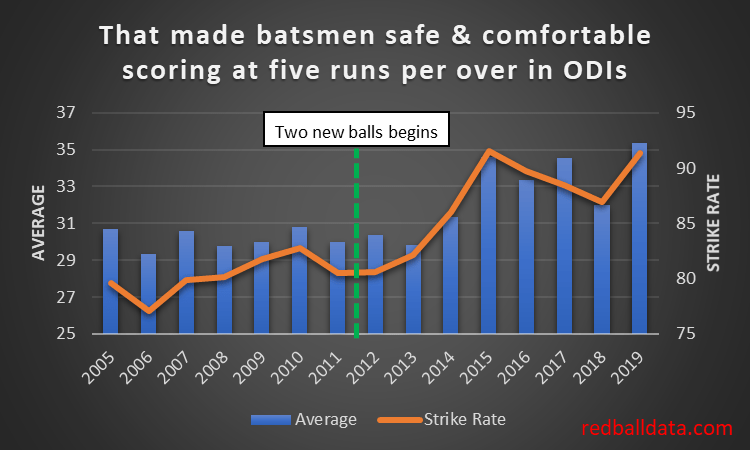
2.ODI batting follows the trend 2015 – 2018
ODI Cricket batting then became more like T20. There’s good reason for this – the optimum strategy for maximizing runs in ODIs became to select T20 players and ask them to score a little more slowly, rather than pick Test players and ask them to score 50% faster.
Fig 2 – Runs per wicket and Strike Rate by year in ODI Cricket (Test teams only). The big jump came after 2014. An aside – there has been focus on how England revolutionised ODI Cricket after their failure at the 2015 World Cup. The above chart shows that that is back-to-front: whatever revolution happened in ODI Cricket happened between 2013 and 2015, then England fixed English one day Cricket.
So far, so good. T20 batting has made ODI’s more interesting. What has it done for Test Cricket?
3.Test Cricket stumbles
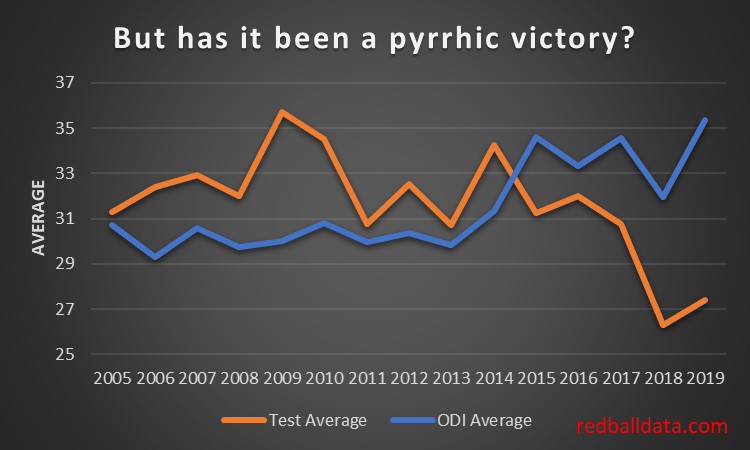
Fig 3 – Evolution of Test and ODI averages since 2005.
Sadly, in all the upheaval, Test Cricket has lost its way.
2015 was the tipping point – it became easier to bat in ODIs than Test Cricket. The real slump has been 2018 & 2019- a paltry 27 runs per wicket.
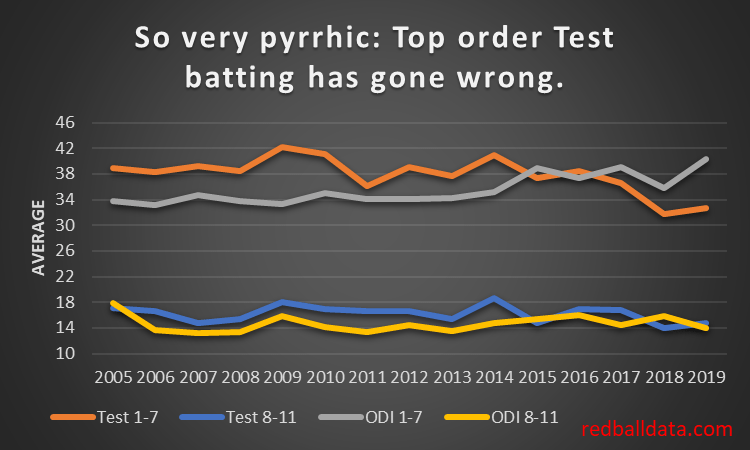
Let’s explore the drivers behind Test batting’s malaise. Firstly, top order batting is the main factor – tail enders are immune:
Fig 4 – Evolution of Test and ODI averages, splitting averages between batsmen 1-7 and 8-11.
Remember the good old days when 38 seemed like a mediocre Test average? That petered out in 2016. Somehow averaging 33 over the last couple of years has been normal. Yuk.
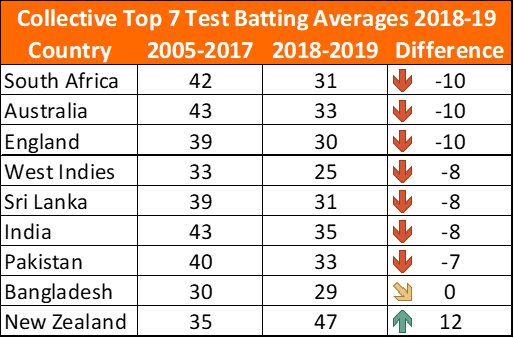
The worst thing? Whatever this disease is, pretty much every team has caught it. Top order Test batting has fallen by the wayside. Test teams are scoring no faster, but averaging less. Hopefully that’s a short term effect caused by the 2019 World Cup. Hopefully.
Fig 5 – Top Seven batsmen, collective average 2005-2017 and 2018-19, plus the difference between the two. Congratulations to NZ for improving and an honourable mention to Bangladesh who have gamely stood their ground. Note that all teams played at least 11 Matches over 2018-19, so with over 100 completed innings for each team we have a decent sample.
Now, I’m not an expert on the technical side of batting – so I won’t try to cover it. A couple of examples though: seeing Jason Roy failing to cope with lateral movement in the World Cup final was alarming. Even more so, watching Bairstow shrink from a world class batsman to one that can’t seem to stop walking past the ball when defending.
Where do we go from here? Some Recommendations to turn the tide:
Be willing to separate Test and ODI/T20 batsmen*. Only some will naturally bridge the two squads.
Don’t combine ODIs and Tests in the same tour – these are now different disciplines, give players clear windows devoted to the red and white ball games.
Selectors at First Class and Test level would see benefit from picking ultra-low strike rate batsmen at the top of the innings. There will be white ball specialists in red ball teams (there aren’t enough red ball players to go round) – thus these players need to be protected from the best bowlers and the new ball. For example, County Championship winners Essex had Westley (Strike Rate 48) and Cook (SR 45) soaking up the tough conditions.
*I use the word batsmen deliberately: none of this analysis has included the women’s game, therefore there is no evidence to suggest the same conclusions are appropriate.
Appendix
A query comes from @mareeswj on Twitter – “Are test match bowlers getting better or the batters getting worse“
To assess how bowling has changed in recent years, one needs to look at the same players’ performances in multiple formats over time. Like in astronomy where having stars of known brightness (“standard candles”) reveals other properties of those stars.
Fortunately, there are 15 bowlers that have taken 15 wickets
in ODIs and Tests both up to Dec-2017, and since Jan-2018.
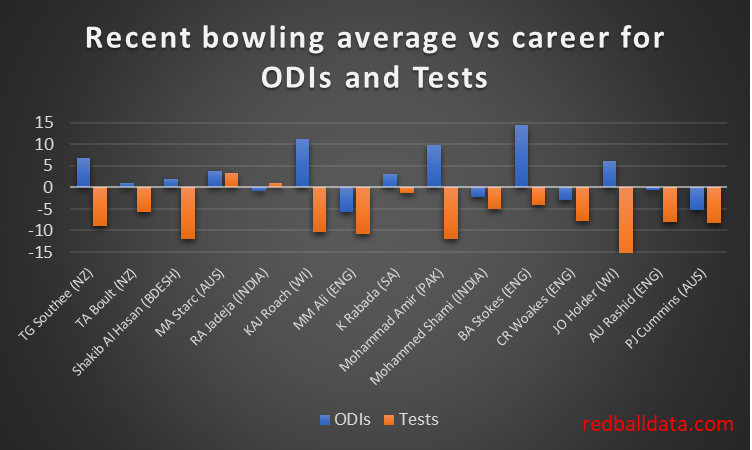
Fig 6 – Comparing All bowlers that have taken: i) 15+ Wickets in Tests up to 31/12/17 ii) 15+ Wickets in ODIs up to 31/12/17 iii) 15+ Wickets in Tests from 1/1/18 to 28/9/19 iv) 15+ Wickets in ODIs from 1/1/18 to 28/9/19
Pretty consistently, they have recently averaged a lot less in Tests (mean reduction in average of 7.6). It’s a slightly more mixed view on ODIs (mean increase in average of 2.8 runs per wicket).
Trying to keep an open mind, what are the possibilities?
Bowlers have focused on red ball cricket
Batsmen have focused on white ball cricket
Pitches are becoming flatter in white ball cricket and spicier in red ball cricket
Ball / umpiring / playing condition changes.
Personally, only #2 feels plausible to me, with the others being secondary effects.
In which I find that batting at seven does give your average a boost of 1.5 runs per wicket when compared to the top six.
I’d read this in Cricinfo back in 2013 and drew the conclusion that if not outs do make a difference, it’s so small I could ignore it for modelling/gambling purposes. As an aside, generally I like to look at things myself before concluding – for some reason the Cricinfo piece sufficed. Possibly because the author was trying and failing to make the case for adjusting averages to reflect not outs.
As counter-arguments go, I couldn’t rely on picking holes in someone else’s argument, I needed some data. Time for Statsguru!
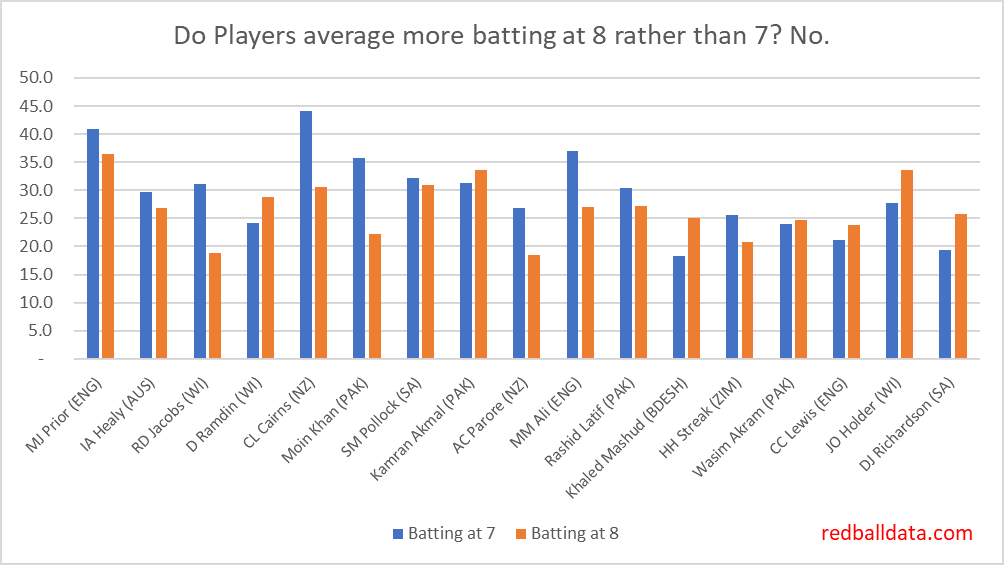
Batting at seven vs eight
Players who have occupied both batting positions will give us the best data on the impact of those positions on average. I took players who had at least 15 completed innings in each role since 1990 and compared performance.
Fig 1 – Averages batting at seven or eight.Fig 2 – Impact of additional not outs on average for players batting at eight rather than seven. Note the wide spread of results – there’s no clear trend. Excel’s trendline says the extra not outs from batting at eight do not boost average.
There’s no clear difference between batting at seven rather than eight.
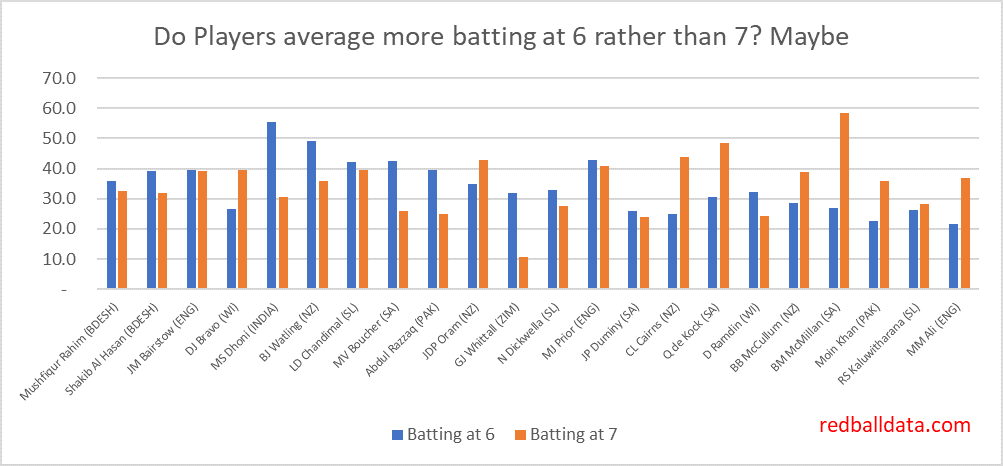
Six versus seven is where it gets more interesting…
Batting at six vs seven
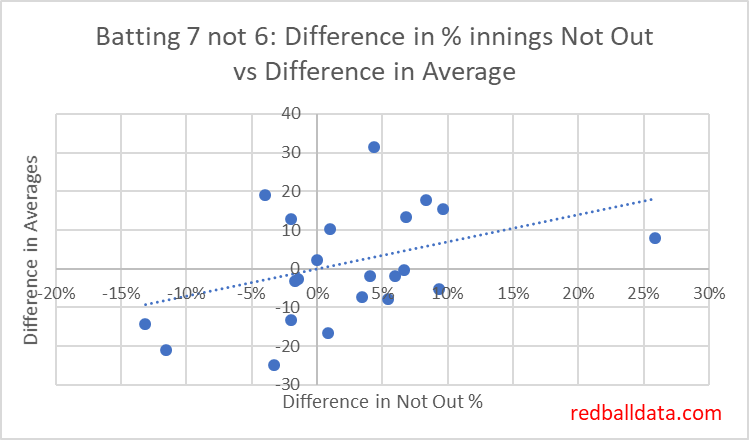
Fig 3 – Averages batting at six or seven. There seems to be a general benefit to batting at seven, but some outliers in Dhoni, Watling, Whittall. Fig 4 – Impact of additional not outs on average for players batting at seven rather than six. Now we have something. The players with more not outs tend to get a higher average. Excel’s trendline agrees – cutting from bottom left to top right.
Discussion
Let’s take stock after that whirlwind of charts. Generally, players that batted at seven got a boost to their batting average, relative to batting at six. This benefit correlates with increased proportion of not outs when batting lower down.
There is no extra benefit from batting at eight rather than seven. But – that is not to say that there’s no overall benefit to batting at eight rather than six: it’s just that batting at eight has the same benefit as batting at seven rather than six.
I’m no fan of the proposals put forward so far for punishing players for being not out. Yet being not out is correlated with higher averages.
A suggested mechanism: Outrunning Bears
Remember the old joke: two guys, out in the forest, chance upon a bear. The bear starts wandering towards them, and one chap starts tying his shoelaces. Second guy asks “what are you doing – that won’t help you outrun the bear?” First guy answers “I don’t need to outrun the bear, I just need to outrun you”.
In nightmarish batting conditions, the top order have next to no chance of protecting their average. Only one batsman outruns the bear to be not out. There’s an advantage of being the last good batsman in the lineup – you just have to survive while the tail gets blown away, and it’s like the barrage never happened – your average is unscathed.
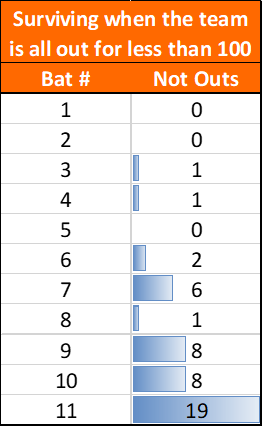
Fig 5 – Batting position of the not out batsman when a Test team has been bowled out for less than 100 since 1990 (top six Test teams only)
There we have it – number seven is having his average flattered because when the going gets tough, the number seven gets red ink. Well, 13% of the time anyway.
Extend that to all tricky batting situations, and there is likely to be a real impact to averages: the top six rarely get a not out in tricky conditions, that benefit belongs to numbers seven to eleven.
Conclusion
Let’s go back to the original question – is Woakes’ batting average benefiting from coming in at eight? I think so.
Can I quantify it? Not yet. All I’ve shown is that the lower batsman are more likely to survive in bad conditions, yet how often do they miss out on the best batting situations? If a team ends 400/4 declared, numbers seven and eight don’t see any of that action.
Does it matter? If comparing two players who bat in the same position then there’s no impact on their data. If comparing a seven and a six’s record, then yes – a rule of thumb would be:
Average adjustment = -70 * (additional not out % from batting at seven not six)
Which works out as about -1.5 runs in moving from seven to six.
Further reading
The Institute & Faculty of Actuaries know a thing or two about risk. Their take is here. I didn’t find it persuasive.
Appendix: Detailed Data
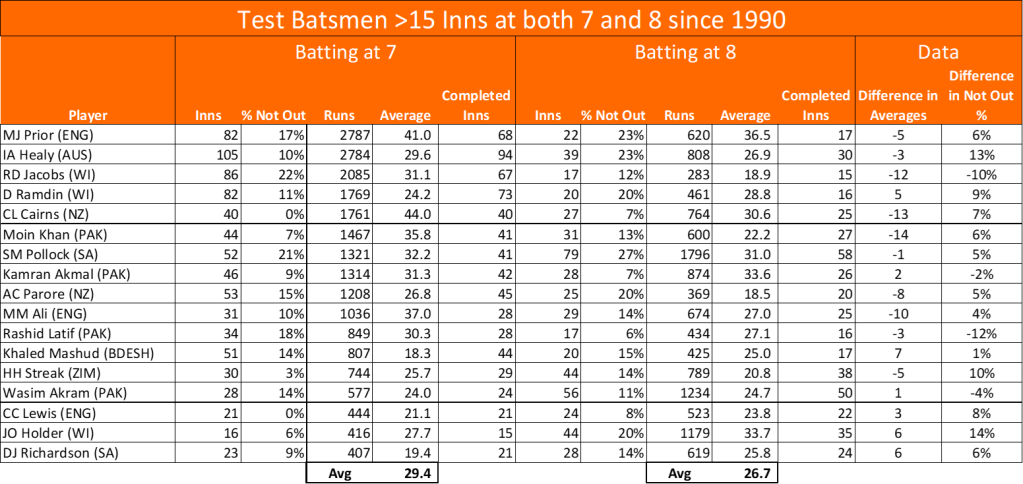
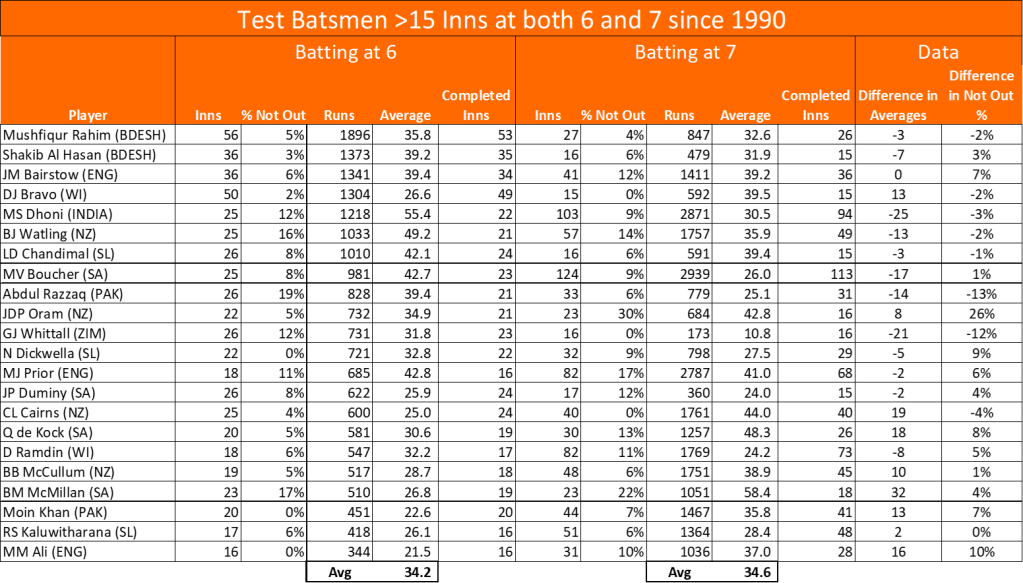
Fig 6 – Full list, batsmen with more than 15 completed innings batting at seven and eight in Tests since 1990. Fig 7 – Full list, batsmen with more than 15 completed innings batting at six and seven in Tests since 1990.
When I was at university there was a rumour that one of the Geology professors was about to predict a massive earthquake in South America. This would have been a career limiting move if nothing happened.
In the end neither the bold prediction or the earthquake materialised.
I thought of that professor’s reputational gamble when I had the idea of asking whether Chris Woakes might be preferred to James Anderson for the Fourth Ashes Test. To misquote Nasser Hussain, “No Ed Bayliss, you cannot do that.”
The scenario
If you are reading this years from now, Sir James Anderson is currently England’s best bowler, though he doesn’t bat very well. Woakes is a decent batsman, and almost good enough to get into the England team as a bowler. Woakes shores up a mediocre top seven and gives the team balance, especially as Jack Leach is a non-batting spinner. Anderson pulled up during the first Test with a calf injury. He missed the next two Tests and has been added to the squad for the fourth. The series is level 1-1 with two to play. Current speculation is that Woakes might make way for Anderson.
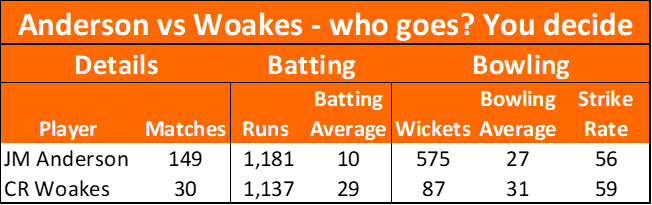
Fig 1 – Career Test records
When weighing the merit of the two players, I’ll look at two factors: England and Australia’s expected runs. To do this, I’ll run my model using each player’s career record as the input* and see how the different teams fare.
Batting
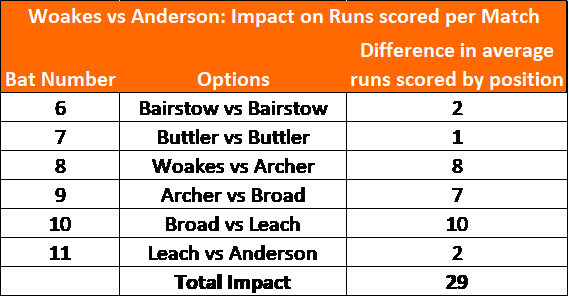
If Woakes were dropped, England would have Broad, Leach and Anderson as a long tail. That means a higher probability that a good batsmen gets left stranded and not out. The following table shows the impact on expected runs over the course of a match of replacing Woakes with Anderson and rejigging the batting order:
Fig 2: Comparing modelled runs scored per Match by batting position in the two scenarios. Note that Bairstow would expect to score two runs fewer per game as a result of more frequently running out of partners.
England would expect to score 29 runs fewer per match with Anderson rather than Woakes.
Interesting that Broad batting at ten outscores Leach in that position by so much – I think it’s because the likely partnerships with Leach at ten (9th wicket: Broad-Leach, 10th wicket: Leach-Anderson) won’t last long.
Bowling
From a bowling perspective, Anderson has an average that’s four runs per wicket better than Woakes. Their strike rates are similar (Anderson 56, Woakes 59). It’s likely this gap is narrower in English conditions (both average 23 at home), but let’s use the raw data rather than run the risk of flattering Woakes.
Note that England have a solid fifth bowler in Ben Stokes, (unlike some teams that would need to use a part-timer if they are bowling all day).
Running this through the model, adjusting for home advantage and Austalia’s brittle batting order, the benefit of Anderson’s bowling over Woakes is 13 runs per match. Not enough to offset the weaker batting.
That seems a little low to me, four wickets per match at four extra runs per wicket would be 16 runs – I think it ends up lower because Australia are away from home and aren’t that strong at batting.
Conclusions
Bringing Anderson into the team for Woakes would be a mistake. Maybe there’s a case for such a change in a must-win match (as the odds of a draw are reduced), but the model does not support such a change for the fourth Test.
It’s important to put this analysis into context. I’m not saying that all specialist bowlers should be replaced by all-rounders. Nor am I saying that Anderson shouldn’t be in the team because he can’t bat.
The head-to-head between Woakes and Anderson is considered in this specific scenario where England have a high quality fifth bowler (Test average 32), but two weak batsmen in Broad and Leach.
James Anderson is England’s best bowler. If fit he should play. If Anderson is fit one needs to reframe the question: you can pick two of Woakes, Broad and Archer. Just make sure one of them is Woakes. Whatever you do, don’t bring in Anderson for Woakes.
*This might be slightly contentious. Any debate on this topic (though the participant may not realise it) will boil down to whether they believe that career record is the right input to use. For example, I’m not making an adjustment for Woakes’ unusually strong home record, nor am I adjusting to reflect more recent performances (which would boost Anderson’s bowling). Nor am I adjusting because Woakes hasn’t scored many runs this series.
When England fans are nervous, hits to my summary of their Test batting options spike. This is the companion piece for bowling, allowing me to monitor a nation’s worries about replacements for Broad and Anderson.
We’ll start by looking at how performances since 2016 translate to expected Test averages, then discuss the implications of that.
Here’s my view of the expected batting and bowling averages of the leading contenders:
Fig 1- Expected Test averages of England’s leading bowlers, based on data since 2016. Note the reversed x-axis: an ideal player would be in the top-right, a weaker player bottom-left. Anderson stands head and shoulders above the other bowling options. For the second and third Ashes Tests, the attack of Broad, Archer, Leach, Woakes, Stokes is pleasing in that all five bowlers are from the best eleven available. Fig 2 – England’s bowling options – those with expected average below 30 and selected others. Note that Archer’s white ball record implies he will be more successful than recent red ball data indicates. County Cricket performances won’t necessarily translate to Test Cricket – where pitches are flatter and games aren’t played in April/May/September in England. Stevens probably wouldn’t average 30 in Tests, but one should start with the data and adjust rather than the other way around.
Discussion
1. Older players & Succession
Five of the top 17 players are aged over 33. That means England
need clear succession plans. Conversely, it also suggests Woakes and Broad
might have more Tests in them than we think: Stevens, Anderson and Clarke have
not diminished with age.
2. Ben Coad
Coad has consistently performed well in Division 1 for Yorkshire. Last three years: 50 wickets at 21 (2017), 48 wickets at 16 (2018), 36 wickets at 25 (2019). You know how Simon Harmer has been tearing up Division 1 and winning games for Essex? He has 156 wickets at 20 since 2016; comparable with Coad’s 135 wickets at 21.
It was a surprise that Coad came out so much better than all other bowlers bar Anderson. Consistency is key – for instance Broad and Woakes had a bad year in 2017 (averaging 36 and 51 in Tests respectively).
The
next red ball Lions activity should feature Coad. It’s astonishing that he
hasn’t played yet. England weren’t far off with the Lions attack of S.Curran,
Gregory, Robinson, Leach, Porter- but they’ve got to find a way to look at Coad.
3. Division 2: Ben Sanderson and Ryan Higgins
I’d like to see Gloucestershire and Northamptonshire get promoted
to Division 1, mainly as the neatest way to get these two playing the best
standard of Cricket available. There’s a significant leap in standard between
Division 2 and Test Cricket, so without ball-by-ball data it’s hard to be sure
how good Sanderson and Higgins are.
If Gloucestershire don’t get promoted this year, I wonder if someone will have a quiet word with Mr Higgins and suggest he seek a Division 1 employer. Higgins is very good. I wrote about him here.
Sanderson is the wrong side of 30, so if he were to get a Test callup it would be following a lot of injuries to younger alternatives. Like James Hildreth he’ll be someone who could have made the step up from Under 19s to the full England side, but never got the chance.
4. Spin options
There’s only one viable spinner- Jack Leach. Even adjusting for the advantage he gets from playing at Taunton, he’s the best England have got. His batting’s not great, so in non-spinning conditions England should consider a batting all rounder instead. Maybe that’s harsh on Moeen Ali, but I think the “most wickets for England in the last 12 months” statistic flatters Ali – taking the longer view, his Test bowling average of 37 is nothing much to shout about.
5. Replacements
If Woakes or Stokes were unavailable: Gregory or Higgins are the
best batting bowlers on the list, capable of slotting in at number eight.
If Broad or Archer were injured (and Anderson still out), Coad would be the logical replacement.
I don’t see Sam Curran as being ready for Test Cricket. His bowling average of 30 flatters him when his first class average is 29: expect it to go up if he plays more Tests. He’s only 21 – for now there are better bowlers out there.
Post-script:
Methodology
To calculate expected Test averages, I took performances over the
last three-and-a-half years in Second XI, County Championship, and Test Cricket
adjusted for the relative difficulty of playing at each level.
I’m aware of two extra elements to add: weighting towards more recent performances and adjusting for age (young players should be getting better). These will take time to calculate, so will have to wait for the Autumn.
There’s a third factor I’d like to look at – the link between ODI and Test performance. Since not all players will perform equally well in red and white ball Cricket, I’m at present unsure how I’d quantify such a measure (eg. X averages 26 in ODIs, therefore is expected to average 32 bowling in Test Cricket).
For the third Test I’d like to see Dominic Sibley open the
batting. To subscribe to this line of reasoning, you’ll need to be persuaded of
two things: firstly, it is not necessary to gain experience in “lesser” Test
series to ensure peak performance in the Ashes. Secondly, that Sibley is one of
the two best opening batsmen England have available.
Opening Up
There’s a school of thought that new players need to be “blooded”
to succeed without first playing against weaker teams in the Test format. The
data indicates that this is a fallacy.
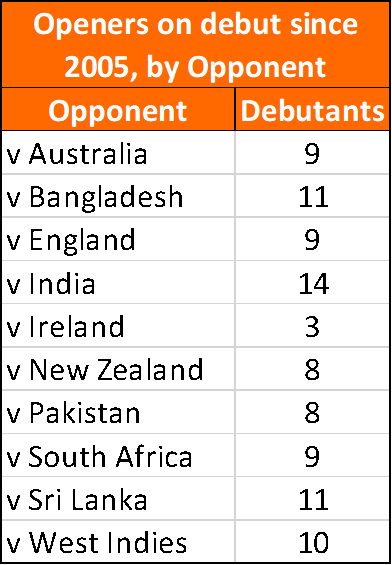
The 96 openers to make their debut since 2005 scored at an
average of 32. That is poor when compared to the average for all openers (36).
However, that’s not the right comparative. Weaker players will play fewer Tests,
so debutants are of lower ability than the average Test player.
A better way of assessing openers on debut is to compare
performance with that player’s career average, adjusted for whether the debut
was at home or away. Looking at it that way, players on debut scored three runs
more per match than expected.
Why should openers do well on debut?
This is unexpected – often players will debut before their
peak, their average will improve as they get better with age. It’s possible
that openers are not thrown in at such a young age as middle order batsmen
(because it’s a specialist position and no one wants to be 0-1).
Another option is that batsmen had an advantage when the
bowler has to played against them before, and is yet to develop a plan. This
may have been the case last decade, but is unlikely in modern cricket.
Note that debuts were evenly spread across opponents- it’s
not like selectors wait for the weaker opponents before trying new players.
Sibley the Best?
Before the summer, I rated Dominic Sibley as a decent opening
batsmen, impressive for a 23 year old, but some way short of Test standard. His
expected 2019 First Class average (based on Championship and 2nd XI
matches from 2016-18) was 36. That made him at best seventh on the list of possible
Test openers. For fans of lists, Burns (51), Stoneman (44), Jennings (42), Mitchell
(40), Hales (39) were ahead of him on merit, and Hameed (expected average 36)
was also ahead because of his fame.
Fast forward to August 2019. Reflecting Sibley’s spring/summer
return of 940 runs in my ratings, his expected Division 1 average jumps to 42.
Tied for second place with Stoneman.
Adjusting for age, Sibley would expect to average 34 in
Tests.
If one limits the search to red ball cricketers, there could
be few complaints with Sibley opening the batting for England.
However, there’s this Roy chap. Top ODI player- averages 43.
Can he make it as a Test opener? Leaving his white ball record to one side
(because I’ve not looked at the predictive power of white ball results on red
ball expectations), in First Class Cricket he averages 38. He has performed
better recently: averaging 43 in Division 1 over the last three seasons.
However, in those three-and-a-half-seasons he barely played: 32 completed Test/Championship/2nd
XI innings while Sibley has 73. Roy didn’t open in either of his games last
year.
Conclusion
Don’t be afraid to give an opener a debut if their record
says they are capable.
A reasonable scenario is that Denly (expected Test average 31) picks up 60-80 runs over the course of the Lord’s Test this week, and is dropped on the back of averaging 24 after ten innings.
Hot on the heels of the 10 team World Cup, Ireland get a chance to prove they deserve a place at the table by giving England a scare in a Test Match.
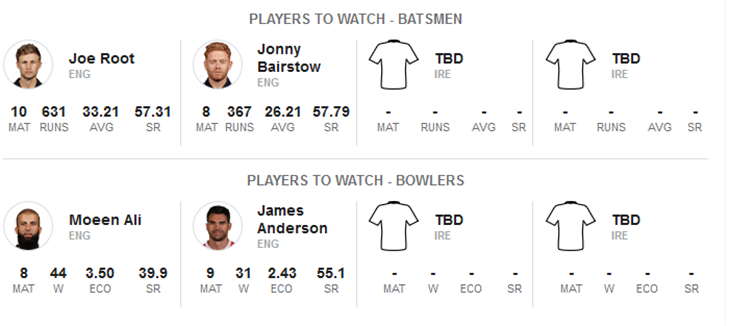
I’ll admit, apart from the bigger names, I’m not all that familiar with the Ireland team. What does the Cricinfo preview say?
Nothing yet. I imagine that feed is automated and thrown by the lack of data.
How to appraise the Irish players who don’t have a Test track record yet? Will try two methods, and clumsily fuse them together to give a sense of how this Test might go. Firstly, there have been plenty of ODIs between Ireland and the World Cup teams. Secondly, most of the Irish players have some County experience. Many players have only played a handful of ODIs against the best teams, or county matches, so will take a weighted average of the two formats.
Now this is not a serious piece of work – it’s a one hour attempt to have some sense of what will happen in a one-off four day Test match. Hopefully it’s good enough for those purposes.
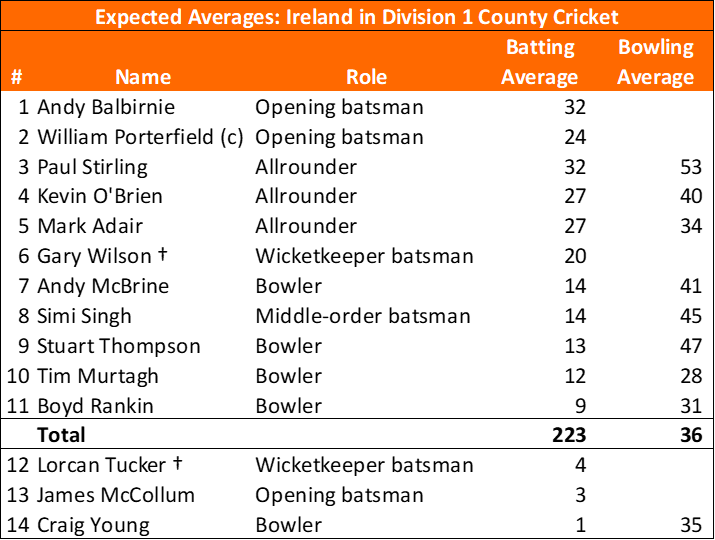
If these two squads competed in Division 1 of the County Championship in 2019, this is how I think they would fare:
Ireland squad for the Test vs England, 24th July 2019. Player descriptions are from Cricinfo.
Ireland have very little batting. This team would surely be the one to go down if they were playing in Division One. Note how Balbirnie and Stirling come out as the strongest batsmen – which wasn’t what I expected. I’d thought Porterfield / O’Brien / Wilson were the best they had. Good to know.
The middle overs should be a good time to bat for England. Beyond Murtagh and Rankin, Ireland will need to find 50 overs from the other bowlers. Might be some tough and wicketless spells, and a tough call for Porterfield about whether he can afford to let England pile the runs on before using his best bowlers when the second new ball is due at 80 overs.
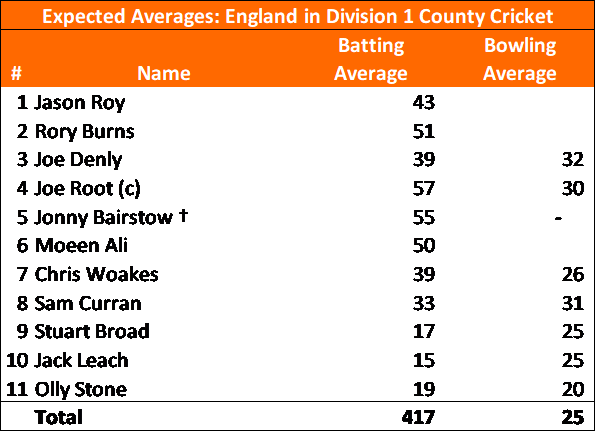
If Ireland would average 220 odd playing in Division One, while conceding 360 when bowling, how would England get on?
Pretty much double the runs. Woakes is a better batsman than any of Ireland’s players. England can also call on seven competitive bowlers.
Roy vs Murtagh / Rankin would be a useful indicator of whether Roy can play Red Ball Test Cricket. It’s only one match, but it’s marginally better than a sample of no matches before the Ashes.
Here’s my conclusions:
Ireland are 55-1 on Betfair to win the Test. I’ve not run the above through the model, but a <2% chance sounds about right.
Before considering Ireland’s Test fixtures, this kind of analysis should be completed so we know what to expect. My personal view is that every effort should be made to give teams like Ireland more ODI matches against the best teams (they average four games per year against the best nine countries). Ireland might be better served playing the weaker Test nations until they have closed the gap with the top eight teams.
I don’t mean to belittle Ireland or come across as someone that’s against the development of Test Cricket – it’s just hard to expect a good contest based on the data.
One of the benefits of twitter is hearing new ideas. Jonas (@cric_analytics) has suggested the third innings should pause when the lead reaches 300, then the fourth innings takes place.
That way, a team that’s winning doesn’t have to pointlessly bat until the lead is over 500, before crushing an inferior opponent. Here’s how Jonas puts it:
I’ve modelled how this would work in practice, with the aim of answering two questions:
Does this make the strong team more likely to win? (Probably)
Is the game over sooner? (Generally)
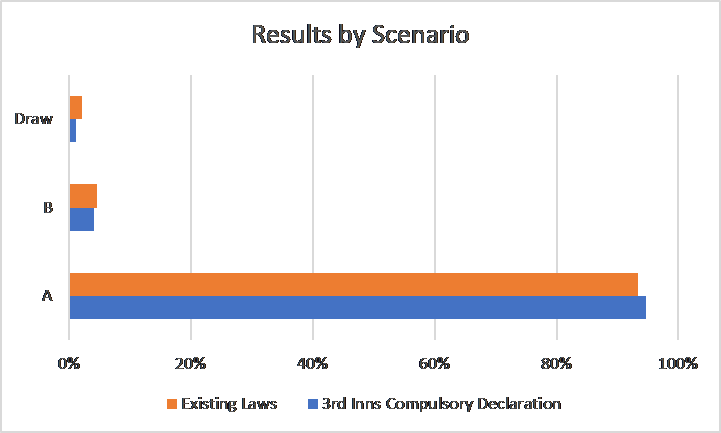
Here’s the summary from the single scenario I looked at:
Scenario: West Indies vs England, Bridgetown.
England have batted first and scored 360. West Indies slipped up and were bowled out for 210. We join the action at the lunch on day three. England lead by 150. Two versions of this were modelled: under the existing laws, and temporarily declaring the third innings if they score 150 more.
Let’s see what happens:
In 92% of cases England made it to 150 without being bowled out – and so, with a lead of 300, temporarily declared
West Indies scored under 300 83% of the time – so the third innings did not need to re-commence
When the West Indies scored more than 300, sometimes the game meandered to a bore draw because the West Indies couldn’t confidently declare
Here’s the distribution of match end times depending on which rules apply:
We can see that there’s a big shift towards Day 4 finishes under compulsory declaration at 300 – mainly from the team batting fourth being bowled out for less than 300.
Worth noting the result wasn’t significantly affected by the rules being used. This would be different in other scenarios – such as if there was less time in the game.
Conclusion – This could be very useful in county cricket (where matches are only 4 days long). Suggest more modelling is required (especially scenarios where the odds are shifted from the draw being favourite to a result being favourite). A trial in County Championship Division 2 would be fascinating.
West Indies can beat England against the odds, but they’ll need their pace bowlers to perform.
****
The blueprint – Bridgetown 2015. 1-0 down in the series, with a first innings deficit of 68, the West Indies were about to be batted out of the Test.Hearing a wicket fall, a reveller in the Party Stand asked “Was that Trott or Cook?” and was baffled to learn that it was in fact Root, and England were 28-4. The new ball had done the damage, and by the time 20 overs had been bowled it was 39-5 and the game was back in the balance.
West Indies were eventually set 192. Darren Bravo marshalled the batsmen to the target with five wickets in hand. The hosts had accrued only three scores over 30 in the Test, but somehow pulled off an unlikely victory, and drawn the series 1-1.
****
With that surprise firmly in mind, let’s make some informed predictions for the upcoming series.
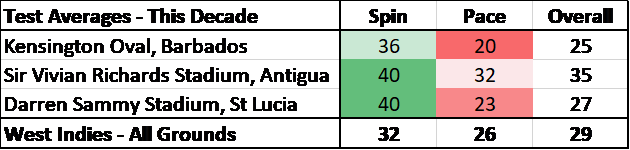
1) One spinner is the right choice. This decade the average is 32 for spinners, 26 for pace bowlers. It may be that pitches are turning more than they used to, and it’s true that spinners get 37% of wickets in the Caribbean, but this turn hasn’t delivered cheaper wickets. That said, if a team can reliably judge a pitch as more spin friendly than the average West Indian pitch, then they should go with two spinners – selectors just need to be sure there will be more in the pitch for spinners than quicks before making that decision.
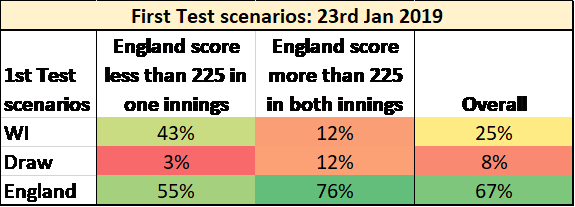
2) West Indies’ best chance will come if their fast bowlers can keep England under 225 in one innings. Turning pitches or not, the West Indies have no elite spinners. If they are going to win this series it will be through devastating fast bowling.
They are unlikely to amass buckets of runs – so Holder’s bowling unit needs to neutralise England’s batting. Specifically, if England score fewer than 225 in one innings, that sets up a target within the range of the West Indian batting.
****
Taking all factors into account, modelling suggests the probabilities for the first test are: 24% WI. 7% Draw. 69% Eng.
West Indies will probably lose: their batting and spin bowling is inferior to England’s. But if we’ve learned anything from the 2015 series, it’s that home advantage is real, and the new ball could do some serious damage, leaving mystified England supporters to ask “was that Burns or Jennings?” as Stokes returns to the pavilion.
“Coach woulda put me in fourth quarter, we would’ve been state champions. No doubt. No doubt in my mind.”
Napoleon Dynamite (2004)
It’s often assumed that we cannot compare Test and first class batting performances – the old comparing ‘apples to oranges’ conundrum. But if we can quantify the relative values of the different formats, we can compare like with like.
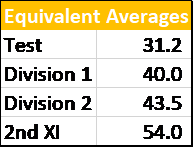
Looking at batting performance of players who’ve played across multiple formats in English* domestic cricket (2016-2018), one can assess the relative difficulty of each tier. My analysis found that it’s 19% harder to bat in Test Cricket than it is in Division 1.
If a player averages 40 in Division 1 – the data says you could expect him to average 31 in Test cricket, 44 in Division 2, and 54 in the 2nd XI.
That tells us that you’d need to consistently average over 55 in Division 2 to average 40 in test cricket – hence so few England players being pulled from those ranks in recent years.
It also means that Hildreth (who I’ve previously thought of as an England option as he averages 41 in Division 1) would be expected to average 32 in Tests, and therefore isn’t the batsman we are looking for.
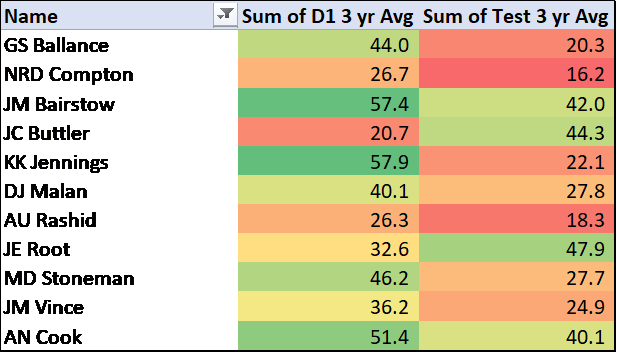
A few examples of 2016-2018 Division 1 and Test averages:
Note that only Root and Buttler underperformed in Division 1 relative to
Test Cricket.
At this point its worth going into the assumptions – professionally I’m
always keen to show where the data ends and the judgement begins. The data can
tell us performances for each player who crosses tiers. Judgement needs to be
applied to appraise that data and turn it into a single factor.
Some options:
Jonas (@cric_analytics) has looked at minimum 10 innings in both competitors – the downside of this is that it excludes valid data points. For instance, Ben Stokes scored 226 @ 28.3 in D1 in the last 3 years – 10 runs below his test average. That should count to the total, even if it’s a small sample. Jonas reckoned a 20% gap between Test and County cricket – slightly wider than my data suggests.
Include all overlap – the risk is that this is skewed by a few high/low scores from one-test wonders against weak/strong opponents. This gives a mere 2% difference between Test and D1.
Overseas players included: this gave an 8% gap between D1 and Test – but playing away from home knocks 10% off batting average, so this is not a fair comparison. To put it another way, Pujara playing for Yorkshire averaged 14, because every game was an away game.
I have used relative performance for English players with >4 completed innings in each format, and weighted the overall result according to the lower of the completed innings in each format. For instance, Ben Stokes has played 8 completed D1 innings, but 46 Test innings – so the overall result is weighted with a factor of 8 because of Stokes’ performances, while Dawid Malan played 36 D1, 26 Test innings, so is more useful for this exercise and receives a weighting of 26.
Adjusting for the level individuals are playing at, allows comparison of players in different tiers. In future posts I’ll look at some implications of this data:
2nd XI players with the potential to be First Class batsmen
England’s best available batsmen
Overseas players: who has & hasn’t succeeded – will look at any trends in the data.
It’ll take more number crunching, but I’m interested in linking First Class / List A performance- to see how well correlated they are, and use that to gauge quality of players for which limited data is available (there are a lot of players with a handful of FC games behind them – too few completed innings to fairly appraise them
*I know it’s English and Welsh. Sorry Glamorgan. There isn’t an easy word for English and Welsh, so I’ll use English as shorthand for English and Welsh.