Debutants in Away Tests have shorter careers

Would you expect players to be disadvantaged by making their debut overseas? Surely the best players get picked and have a decent run in the side until there’s sufficient data to disprove the analysis that got them selected in the first place?

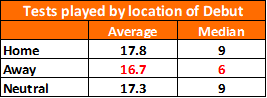
Afraid not. Away Debutants are discriminated against! Debut at home you can expect a nine Test career. If your first game is an away match, that drops to six.

Fig 1 – Average (Mean) and Median Tests played by location of Debut. Includes top nine Test teams, since 2005.

A reminder – home advantage in Test Cricket is big. Somewhere around 17%, depending on how you cut the data. If your expected batting average is 35, that’s 38 at home and 32 away. A player who starts their career overseas is likely to underperform, and is at greater risk of being dropped when the naïve assertion is made “OK, they have a decent First Class Average, but they are only averaging 29 in Tests.”

Half of Away Debutants don’t make it to seven Tests. And yet the mean number of Tests played by Home Debutants is only 1.1 matches more than Away Debutants. For some reason the early benefit to Home Debutants doesn’t persist. What happens after seven Tests to explain that?

Fig 2 – Frequencies of Number of Tests played. Includes top nine Test teams, since 2005.

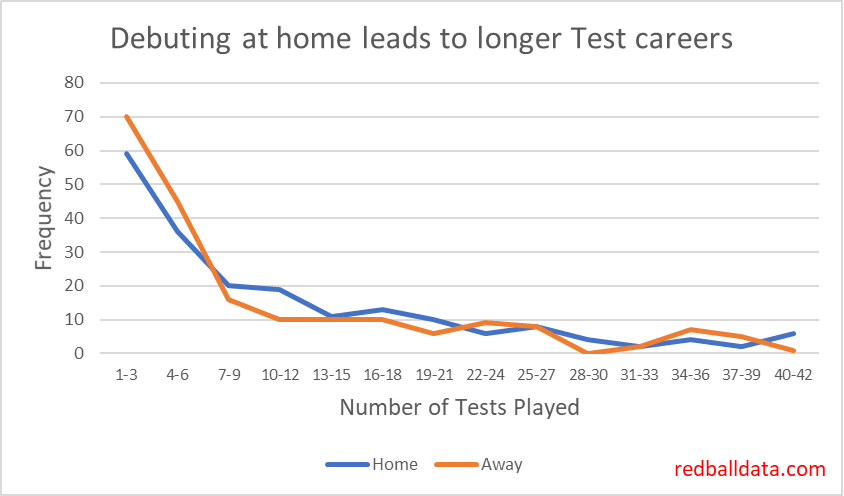
The behaviour flips – from Tests 7-20 more Home Debutants are discarded than Away Debutants. I expect that this is because some players who had an easy home series to get into Test Cricket then get caught out when away from home.

After 20 Tests, a player has generally played a similar numbers of home and away Tests, so there’s no great difference between the two curves.

So What?

  1. Some Away Debutants play fewer Tests than they deserve. Conversely, some Home Debutants are kept in the team longer than they should be as a result of the stats boost they get from playing more home Tests than away.
  2. It’s time to move on from raw averages. Adjusted averages are the future. Not just adjusted for home/away, but also the ground they are playing on (think Headingley vs The Oval), the quality of opposition and the innings number. This is not a complicated task, and I’d be very surprised if it isn’t already happening behind closed doors. Admittedly I haven’t yet done this when rating Test players. But then, this is a hobby for me. Also, until a player has played 20 matches, I use their First Class average to appraise them. Which is coincidentally the point at which Debut Location ceases to matter as an input.
  3. Don’t make your Test Debut in an away game if you can help it. I appreciate this is not practical advice, so instead, if anyone reading this has made their Debut in an away game, make sure you quote your home/away adjusted average whenever possible! Ebadot Hossain, am looking at you.

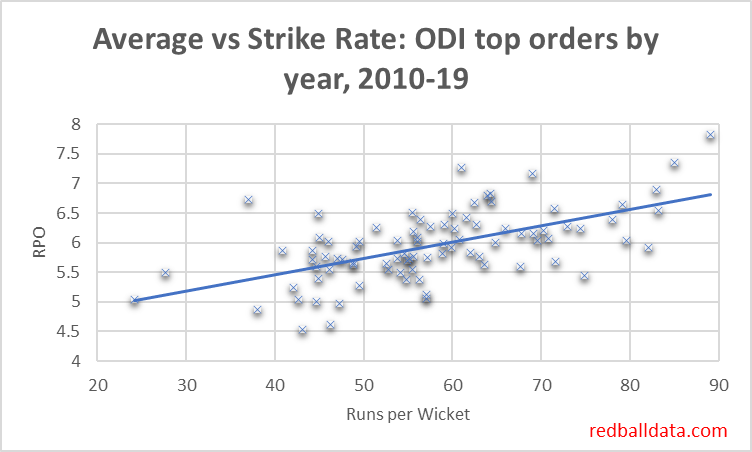
It’s almost the same story for ODIs

A quick calculation says Home Advantage in ODIs is c.11%, so we would expect ODI debutants to have similar trends to Tests. Which is true for matches 0-20: Away Debutants are more readily discarded after a handful of games, then Home Debutants are in the firing line from 4-20 matches.

Fig 3 – Frequencies of Number of ODIs played. Includes top nine ODI teams, since 2005.

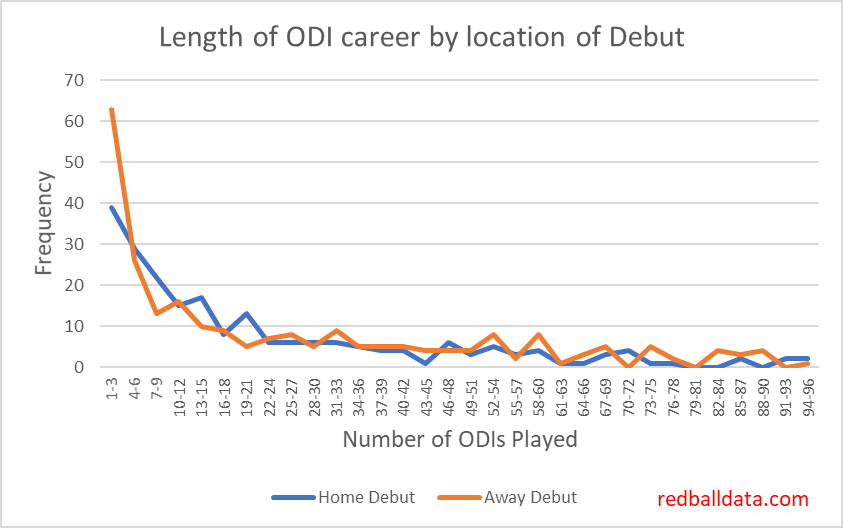
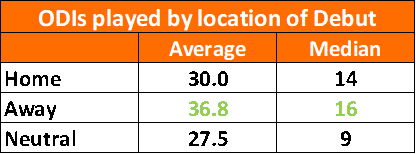
After 20 matches it gets more interesting. Overall, Away Debutants have greater longevity on both a mean and median basis. Of the Post-2005 players with more than 100 ODI Caps, 16 began at Home, 22 began Away.

Fig 4 – Average (Mean) and Median ODIs played by location of Debut. Includes top nine teams, since 2005.

What the dickens? I can’t confidently explain this. Could have hidden it from you, but it’s interesting and therefore worth sharing, even if I don’t understand it. I’ll offer one possibility: ODI series are often tacked onto Test series, so in an away series the star Test players stay on for the ODIs, meaning that only highly regarded red ball players make the team. At home, the top Test players can more easily be rested, so lesser known players might get a go.

The Short List: Away Test Debutants

Below is the list of players that played fewer than seven Tests, and started away from home. Have a read, see if you can pick out some players who might have had 20 Tests if given the benefit of a home debut. Luke Ronchi and Owais Shah jump out at me.

Fig 5 – Players to Debut away from home since 2005 and play fewer than seven Tests. Data implies 20 of these players would have played 20 Tests if they had debuted at home.

A review of England’s bowling options

When England fans are nervous, hits to my summary of their Test batting options spike. This is the companion piece for bowling, allowing me to monitor a nation’s worries about replacements for Broad and Anderson.

We’ll start by looking at how performances since 2016 translate to expected Test averages, then discuss the implications of that.

Here’s my view of the expected batting and bowling averages of the leading contenders:

Fig 1- Expected Test averages of England’s leading bowlers, based on data since 2016. Note the reversed x-axis: an ideal player would be in the top-right, a weaker player bottom-left. Anderson stands head and shoulders above the other bowling options. For the second and third Ashes Tests, the attack of Broad, Archer, Leach, Woakes, Stokes is pleasing in that all five bowlers are from the best eleven available.
Fig 2 – England’s bowling options – those with expected average below 30 and selected others.
Note that Archer’s white ball record implies he will be more successful than recent red ball data indicates.
County Cricket performances won’t necessarily translate to Test Cricket – where pitches are flatter and games aren’t played in April/May/September in England. Stevens probably wouldn’t average 30 in Tests, but one should start with the data and adjust rather than the other way around.

Discussion

1. Older players & Succession

Five of the top 17 players are aged over 33. That means England need clear succession plans. Conversely, it also suggests Woakes and Broad might have more Tests in them than we think: Stevens, Anderson and Clarke have not diminished with age.

2. Ben Coad

Coad has consistently performed well in Division 1 for Yorkshire. Last three years: 50 wickets at 21 (2017), 48 wickets at 16 (2018), 36 wickets at 25 (2019). You know how Simon Harmer has been tearing up Division 1 and winning games for Essex? He has 156 wickets at 20 since 2016; comparable with Coad’s 135 wickets at 21.

It was a surprise that Coad came out so much better than all other bowlers bar Anderson. Consistency is key – for instance Broad and Woakes had a bad year in 2017 (averaging 36 and 51 in Tests respectively).

The next red ball Lions activity should feature Coad. It’s astonishing that he hasn’t played yet. England weren’t far off with the Lions attack of S.Curran, Gregory, Robinson, Leach, Porter- but they’ve got to find a way to look at Coad.

3. Division 2: Ben Sanderson and Ryan Higgins

I’d like to see Gloucestershire and Northamptonshire get promoted to Division 1, mainly as the neatest way to get these two playing the best standard of Cricket available. There’s a significant leap in standard between Division 2 and Test Cricket, so without ball-by-ball data it’s hard to be sure how good Sanderson and Higgins are.

If Gloucestershire don’t get promoted this year, I wonder if someone will have a quiet word with Mr Higgins and suggest he seek a Division 1 employer. Higgins is very good. I wrote about him here.

Sanderson is the wrong side of 30, so if he were to get a Test callup it would be following a lot of injuries to younger alternatives. Like James Hildreth he’ll be someone who could have made the step up from Under 19s to the full England side, but never got the chance.

4. Spin options

There’s only one viable spinner- Jack Leach. Even adjusting for the advantage he gets from playing at Taunton, he’s the best England have got. His batting’s not great, so in non-spinning conditions England should consider a batting all rounder instead. Maybe that’s harsh on Moeen Ali, but I think the “most wickets for England in the last 12 months” statistic flatters Ali – taking the longer view, his Test bowling average of 37 is nothing much to shout about.

5. Replacements

If Woakes or Stokes were unavailable: Gregory or Higgins are the best batting bowlers on the list, capable of slotting in at number eight.

If Broad or Archer were injured (and Anderson still out), Coad would be the logical replacement.

I don’t see Sam Curran as being ready for Test Cricket. His bowling average of 30 flatters him when his first class average is 29: expect it to go up if he plays more Tests. He’s only 21 – for now there are better bowlers out there.

Post-script: Methodology

To calculate expected Test averages, I took performances over the last three-and-a-half years in Second XI, County Championship, and Test Cricket adjusted for the relative difficulty of playing at each level.

I’m aware of two extra elements to add: weighting towards more recent performances and adjusting for age (young players should be getting better). These will take time to calculate, so will have to wait for the Autumn.

There’s a third factor I’d like to look at – the link between ODI and Test performance. Since not all players will perform equally well in red and white ball Cricket, I’m at present unsure how I’d quantify such a measure (eg. X averages 26 in ODIs, therefore is expected to average 32 bowling in Test Cricket).

Further reading

Wisden tipping Coad for greater things: https://www.wisden.com/stories/county-cricket/ben-coad-yorkshires-late-bloomer-englands-potential-wildcard – no doubt I’m not the first to notice that Coad is rather good.

The Ashes: A tale of two spinners

I wrote an Ashes preview. It was boring. You won’t be subjected to it. Fortunately, when researching that I noticed a strange feature of Nathan Lyon’s bowling: he is great in the first innings of a Test.

At the time of writing it’s unclear whether we’ll see Moeen Ali vs Nathan Lyon as the opposing spinners in the 2019 Ashes – Ali’s batting has been poor of late, so it’s hard to justify his selection. Easier to make seam-friendly wickets and neutralise Lyon. Career averages show why that’s tempting:

Fig 1 – Nathan Lyon and Moeen Ali’s Test bowling records (as at 30/7/19)

That data masks two things – firstly, since 2017 both bowlers average 29. Secondly, and interestingly, how they perform through a match.

Fig 2 – Lyon (Yellow Triangle) and Ali (Green Square) by Innings of the match. Axes are the same in all four charts.

Let’s walk through that quartet of charts. In the first Innings, Nathan Lyon is about as good as it gets. An average of 32 is 11 runs per wicket better than the average for all spinners. He’s right up there with Ashwin & Jadeja. Moeen Ali is, frankly, awful. Averaging 16 more runs per wicket than Shane Shillingford. That Green Square is poles apart from Lyon’s Yellow Triangle.

Through the second and third innings, Nathan Lyon stubbornly refuses to improve. The chasing pack catches him, then outshines him by the third innings. Ali is comparable with him at that point (and within touching distance of the rest).

Now it gets weird. If anything, Lyon is worse in the fourth innings. A bowling average of 34 is now ten runs worse than that for all spinners since 2010. The control is still there, as his economy rate is unaffected. The sample size is fine (58 wickets in the fourth innings). Odd.

Meanwhile, the fourth innings is Ali’s playground. 59 wickets at 22, he’s right up there with the big boys. Go Green Square, go!

Let’s end with some practical uses for this, before it becomes pub trivia.

  • Nathan Lyon can be part of a four man attack for Australia – he can bowl effectively in the first innings, so Australia don’t need to play four quicks to have sufficient firepower early in the match.
  • Moeen Ali shouldn’t bowl in the first innings for England. Stokes can play the role of fourth bowler, and Ali should bowl no more than ten overs per day. Save him for later in the game.

Further Reading

Cricinfo independently noticed this back in 2017 (ie. I haven’t copied them, honest!) Unfortunately for them, they attributed the difference to the Asian continent. That quirk has now been ironed out.

Could Woakes open the batting in Tests?

My thinking was akin to some shambolic calling when running between the wickets: No. Yes. Wait – No!

No – Jonathan Agnew suggested that Chris Woakes was a potential opener a few years ago. To paraphrase, Woakes was someone that could do a job, perhaps on tour if an opener got injured.

This sounded ridiculous- fast bowling all rounders don’t open the batting, especially when they normally bat at six or lower. Presumably this was just a case of a commentator getting carried away during a long stint at the microphone.

Yes – And yet, as time went on, with Cook appearing to struggle and Strauss’ shoes unfilled, maybe there was some sense to it. With Root refusing to move up from number four, England had two top three places to fill (soon to be three once Cook retired).

Wait – Hang on. Easy to have wild ideas from the sidelines, would anyone really pick an untested all rounder to open the batting when they could pick from an assortment of county openers? One would have to be pretty desperate. Best to give Ali, Burns, Buttler, Compton, Denly, Duckett, Hales, Hameed, Jennings, Root, Roy, Stoneman a go before doing anything rash!

And maybe England do see something in Woakes’ batting – he batted at three against West Indies in the World Cup. Time to look at this properly.

No – While I can’t see any record of Woakes opening the batting, we can see performances against the second new ball. Not a bad proxy for performance at the top of the innings. Soon I’ll build a County Championship ball by ball database, for now his Test record will have to suffice:

Chris Woakes’ overall batting average is 29 in Tests, 35 in First Class. While he has only been dismissed nine times when batting during overs 80-100, averaging 26 in that period says that if anything Woakes would average less than his career average if he opened the batting.

Also, moving a weaker batsman up to open moves everyone else down one place. That increases the chance a batsman runs out of partners. Not ideal.

Not an especially interesting conclusion: Woakes could but shouldn’t open the batting for England.

Should Buttler bat up the order in ODIs?

Having a model for ODI Cricket is great when it comes to considering selection, or gambling, but it’s challenging to come up with further practical uses. Fortunately, some recent tweets about batting orders gave me an idea – using the model to suggest the optimum batting order.

England have batsmen with averages and strike rates to get excited about. The current top six is Roy, Bairstow, Root, Morgan, Stokes and Buttler.

Jos Buttler’s career strike rate is 120. He once scored a century in sixty-six balls. If England get a good start, at what point should they push Buttler up the order so he isn’t watching from the pavilion when he could be swishing sixes? He has finished “not out” in 23 of his 116 innings – and could have contributed more in each of those matches if he had been on the field earlier.

Firstly, let’s consider how Buttler has performed by batting position:

Fig 1 – Buttler’s performances batting in ODI Cricket, up to 13/07/2019 by position in the batting order.

The more excitable among us would conclude that six is Buttler’s weakest position, and he has to bat at four or five based on the above averages and strike rates. Personally (and somewhat arbitrarily), I’d like a 20 innings sample size before concluding. All the table above says is there’s no compelling reason why Buttler can’t bat anywhere in the middle order.

So what number should Buttler bat? Using a model of ODI cricket, simulating England batting against their own bowlers at Chester-le-Street*, we can predict performance for England’s usual batting order and compare that to Buttler jumping up two places to number four.

The Duckworth-Lewis method tells us that the way batsmen play at each stage in the innings is a function of how many wickets have fallen. The hypothesis is that the earlier the second wicket falls, the more conservatively England will bat, and thus the less useful it is to promote Buttler. It would actually be counterproductive, because if he’s out he’s not around to score quickly at the end of the innings.

Scanario time: we join the action at the fall of the second wicket, Roy and Bairstow the men out.

Fig 2 – modelled impact of moving Buttler to bat at four rather than six. x-axis represents the over in which the second wicket falls.

The chart shows that promoting the swashbuckling Buttler too early has a slightly adverse impact on expected runs (he’s not the person you want at the crease as you rebuild – hold him back). If the second wicket falls any time after 20 overs, it is beneficial to move Buttler up to number four. The later in the innings the second wicket falls, the more important it is to promote Buttler.** That said, the benefit is less than one run for overs 20-30, so if the batsmen are concerned a fluid batting order could cause them to underperform, coaches should take heed.

Note that the benefit starts to shrink very late in the innings – as the number four will only face a handful of balls anyway.

To put the previous chart into context, here’s a comparison between the two scenarios:

Fig 3 – Modelled median runs scored after the fall of the second wicket. x-axis shows different stages in the innings when the second wicket falls.

The two curves are very similar. If your eyes (and/or phone resolution) are up to it, you’ll see that the blue line (Buttler in at six) underperforms the orange line, especially in the latter stages of the innings.

England have an analyst with a ball-by-ball ODI model. Has he already done this analysis and are England already applying it? Consider the evidence of the World Cup Group Stages:

  • #6 vs Australia. Comfortably chasing 224 when the second wicket fell with the score on 147 in the 20th over. Morgan bats at four, England don’t lose another wicket.
  • #4 vs New Zealand. Second wicket falls in the 31st over. Buttler promoted to four.
  • #6 vs India. Second wicket falls in the 31st over. Third wicket falls in the 32nd over. Buttler bats at six? Takes revenge on the ball, scoring 20 from eight balls.
  • #6 vs Australia. England 53-4 in the 14th over when Buttler comes to the crease. Couldn’t realistically hold him back any longer.
  • #6 vs Sri Lanka. England three down inside 20 overs, Buttler held back to number six.
  • #5 vs Afghanistan. England 169-2 after 29.5. Morgan goes in, hits 148 (71). Buttler doesn’t get a turn until the third wicket falls in the 47th over.
  • #4 vs Bangladesh. 205-2 (31.3). Buttler promoted to four.
  • #6 vs Pakistan. England three down with just 86 on the board. Buttler comes in when the fourth wicket falls.
  • #6 vs South Africa. 111-3 (19.1). England play it safe and Buttler bats at six. Fair enough.

England’s strategy broadly follows the recommendations in this post (and therefore what an ODI simulator would recommend). Two exceptions: against Afghanistan and India. It would be fascinating to know why Buttler batted at four against New Zealand, but not (in similar circumstances) against India.

We can conclude that with their current batting order, England should move Jos Buttler up the batting order if the second wicket falls after the 30th over. A word of caution – the 90million balls I modelled were for this specific scenario, and not the general case. If you would like me to consider another scenario, please do get in touch via the “Contact” page or @edmundbayliss on twitter.

*If I had my time again I wouldn’t have had England playing against themselves and at a ground with high ODI batting averages. Regrettably, I neglected to update those inputs after a World Cup game there. If the modelled runs in this piece feel high to you, that’s why.

**It’s human nature to pick one reason for an outcome. “If the coach had just tweaked the order, we would have put enough on the board”. It’s seldom that clear cut. These batting order changes are worth up to three runs, very much in the “extra one percent” territory.

Left arm pace in ODIs – where are all the part-timers?

Like most sports fans my weekends can include shouting at the radio. Unlike most sports fans I’m usually het up about statistics, not necessarily the performances on the field.

Last weekend it was claimed that the Indian middle order has a weakness against left arm pace in ODIs. I won’t name the individual that said it, because they are an excellent commentator and this isn’t intended to be a criticism of them.

What’s wrong with that claim? Left arm pace bowlers are normally front line bowlers, so are better than the average bowler. That means that when it is said that “X does badly against left arm quicks” we really mean “X is less good against the better bowlers”. Of course they are, we all are!

Time for a couple of charts. Firstly, there’s a clear distinction between performance of front line bowlers (ie. those that bowl on average more than six overs per innings) and the “change” bowlers:

Fig 1: Bowling records for the 10 World Cup teams this decade.

Note the key difference in average between front line and backup bowlers – 12.1 runs per wicket. It’s likely that the backup bowlers bowl in the middle overs, so flattering their Economy Rates compared to the bowlers trusted to finish the innings.

Sampling the data in any way that includes a greater proportion of front line bowlers will give metrics that indicate batsmen are struggling. For instance, by only measuring performance against left arm pace bowlers!

Next, the same view as above, but with left arm pace bowlers. Note how high the average overs per innings are for left arm pace bowlers. There’s a full list of bowlers at the end of this piece.

Fig 2: Bowling records for the 10 World Cup teams this decade. Split between left arm pace and others.

Left arm pace bowlers average 12% less than other bowlers (admittedly while conceding runs 3% faster). For analysis of the advantages left arm pace bowlers have, refer to this Cricinfo article http://www.espncricinfo.com/magazine/content/story/851399.html

But why wouldn’t there be part-time Left arm quicks? It could be margin of error: bowling over the wicket to a right hander, straying onto the pads is risky while conservatively keeping a consistent line outside the off stump takes bowled and LBW out of the equation.

Summing up, we can draw two conclusions. When considering performance against a sub group of bowlers, one needs to adjust for the quality of that sub-group. The smaller the sub-group, the more careful you need to be. Also, expect all batsmen to average 12% less against left arm pace bowlers in ODIs.

Appendix

Fig 3: All left arm pace bowlers to have played ODI Cricket for the 10 world cup teams since 2010.

There’s barely a part-timer in the group. Only Anderson, Franklin, Udana, Reifer averaged less than six overs per innings – and Raymon Reifer has only played two games!

Still reading? Here’s another example to make the point: imagine a naïve Cricket Analyst for a Test team at the end of last Century. Crunching the numbers they see that most batsmen underperform against leg spin, so recommend the selectors fast track a ‘leggie’. The unfortunate Analyst didn’t notice that there weren’t very many leg spinners out there. All they’ve really discovered is that it wasn’t easy to face Shane Warne, Mushtaq Ahmed or Stuart Macgill. That’s not especially insightful: right data, wrong conclusion.

Matchups and Opportunity Cost

There’s a theory (which I just invented) that you could listen to old radio broadcasts of Cricket and be able to judge the date by the buzzwords of the era. For 2019, it’s “Matchups”: pitting bowlers against the optimum batsmen to stifle run scoring and take cheap wickets.

Matchups seem like a plausible proposition – get enough data, find some patterns, check you’ve got a decent sample size and out will pop some options to consider. Note the need for a plausible proposition (ie. not “Roy struggles against the flipper in the top of the hour when the bowling is from the North-West”).

There are three issues I have with the use of Matchups.

Firstly, they aren’t publicly available – if a pundit refers to X having a weakness against a particular type of bowling, the viewer/listener has no way of knowing if that’s a fact or an opinion. In times gone by, we could accept that all such utterances were opinions, and who better to go to for opinions than people who report on the game for a living? The balance has shifted – so now when hearing “Bairstow struggles against spin early in the innings”, it could be opinion, bad data*, or a solid piece of analysis. There’s something unsatisfying about that.

Secondly, we don’t know if Matchups work. If each one is a hypothesis, it should be easy to aggregate them in order to compare results and expectation. I expect much of this is – understandably – happening behind closed doors. My hunch is also that many Matchups evaporate as statistical flukes, so are of no benefit. If you’re aware of a rigorous assessment of Matchups, please do drop me a line on twitter or via the Contact page on this site.

Finally, and of relevance to the Cricket World Cup, there’s an opportunity cost associated with changing bowling plans. Especially in ODIs where bowlers need rest during an innings.

Let’s explore that Opportunity Cost – what are the downsides of opening with spin? We can expect more teams to open with spin against England after Bairstow fell first ball against Imran Tahir. Here’s how South Africa used their bowling resources that day:

Fig 1: Overs bowled by each player

Early wickets have a big impact on expected score – but one cannot fully appraise the impact of opening with Tahir without taking all factors into account.

  • Rabada didn’t get the new ball. He then had to condense 10 overs into 44, rather than across 50 – does that impact the pace he can bowl?
  • After 24 overs, with the score on 131-3, Faf du Plessis threw the ball to JP Duminy. Five of the next eight overs were bowled by Duminy and Markram. On this occasion it worked – 5-0-30-0 is not too bad. But it’s the big picture that matters, not one innings.
  • Pretorius only bowled seven overs, Phehlukwayo eight. Without a medium pacer or second spinner than can bowl 10 overs in a row, once a team opens with spin, they are probably going to underuse their fourth and fifth bowler.

What are the factors to consider when weighing up whether to open with a spinner in a four pace / one spin attack?

  1. Will it work? What is the increase in chance of a wicket versus the default option?
  2. What are the relative strengths of your sixth (and possibly seventh) best bowlers, compared to your fourth and fifth?
  3. How fit is the bowler who won’t now be opening? Are you confident they can bowl 10 out of 44 overs? How many days since your last game?

What have we learned? The value of a Matchup is the expected gain from one pairing over another, less the downsides of changing the bowling order to accommodate using a specific bowler at a particular time.

* A word on bad data: Andrew Strauss averaged 91.5 against Mitchell Johnson in Tests. It’s a nice piece of trivia, but it’s only based on Strauss scoring 183-2 against Johnson. I doubt this would have much predictive power. Using that as a basis of prediction is roughly the equivalent of writing off Graham Gooch after he bagged a pair on debut.

Further reading: Cricmetric.com claims to have Matchup data for Batsmen vs Bowlers – I’ve no reason to doubt their data.

What’s a dropped catch worth in ODI Cricket?

Jason Roy dropped the ball today. I didn’t see it, but apparently it was rather an easy catch. Pakistan went on from 135-2 (24 overs) to finish 348-8, a score just out of England’s reach. The final winning margin was 14 runs.

What did that drop do to Pakistan’s expected score? Here’s the simulations for the two scenarios: 136-2 (24.1) and 135-3 (24.1)

Fig 1: Two scenarios for the 145th ball of Pakistan’s Innings: Out or one run scored.

If Hafeez had been out, the mean score was 350, while the dropped catch increased the mean score to 377. That’s a 27 run impact.

Can we break that down?

  • Firstly, the runs scored on that ball. Value = one run. Easy.
  • Secondly, the reduced run rate as a new batsman plays themselves in. According to some analysis I’ve done on how batsmen play themselves in, that’s worth four runs (Hafeez had faced 12 balls by this point, so would have been just starting to accelerate).
  • The rest of the impact (22 runs) comes from two factors: more conservative batting as Pakistan from having fewer wickets in hand, and the increased chance of getting bowled out (and thus not using all their overs).

To generalise, the cost of a dropped catch would be a function of:

  • Runs scored on that ball
  • Whether the surviving batsman is set
  • How long left in the innings (the wicket affects the value of future deliveries. Thus the later in the innings a wicket falls, the lower the value of that wicket)
  • How many wickets the batting team has in hand (does the wicket cause more defensive batting)? In this case, being three wickets down after half the innings still leaves plenty of scope for aggressive batting so doesn’t have as big an impact as it could.
  • Strike Rate and Average of the reprieved batsman relative to the rest of the team (dropping Wahab Riaz is better than dropping Babar Azam).

Interesting topic. I might come back to this when other people drop sitters.

Fantastic boundaries and when to find them

Using a ball-by-ball database of 2019 ODIs, I’ve looked at boundary hitting through the innings. This was to refresh my ODI model, which was based on how people batted in 2011.

Fig 1: Boundary hitting by over. ODIs between the top nine teams, Q1 2019

Key findings:

  • First 10 over powerplay: 10% of balls hit for four, c.2% sixes. Just two fielders outside the ring.
  • Middle overs 10 – 40: c. 8% balls hit for four, c. 2% sixes. Four fielders outside the ring limits boundary options. Keeping wickets in hand mean batsmen don’t risk hitting over the top, though if wickets in hand the six hitting rate starts to pick up from the 30th over.
  • Overs 40-45: Six hitting reaches 5%. No increase in the number of fours: five boundary riders give bowlers plenty of cover.
  • Overs 46-50: Boundary rate c.18% with boundaries of both types picking up.

These probabilities have been added to the model, which now makes some sense and isn’t claiming a 6% chance England score 500!

An early view of what the model thinks for Thursday’s Cricket World Cup opener – if England bat first 342 is par. 69% chance England get to 300, 20% chance of England getting to 400. I can believe that, it is The Oval after all.

The ODIs they are a’changing

My ODI model was built in those bygone 260-for-six-from-50-overs days. Having dusted it off in preparation for the Cricket World Cup it failed its audition: England hosted Pakistan recently, passing 340 in all four innings. Every time, the model stubbornly refused to believe they could get there. Time to revisit the data.

Dear reader, the fact that you are on redballdata.com means you know your Cricket. Increased Strike Rates in ODIs are not news to you. This might be news to you though – higher averages cause higher strike rates.

Fig 1: ODI Average and Strike Rate by Year. Top 9 teams only. Note the strength of correlation.

Why should increasing averages speed up run scoring? Batsmen play themselves in, then accelerate*. The higher your batsmen’s averages, the greater proportion of your team’s innings is spent scoring at 8 an over.

Let’s explore that: Assume** everyone scores 15 from 20 to play themselves in, then scores at 8 per over. Scoring 30 requires 32 balls. Scoring 50 needs 46 balls, while hundreds are hit in 84 balls. The highest Strike Rates should belong to batsmen with high averages.

Here’s a graph to demonstrate that – it’s the top nine teams in the last ten years, giving 90 data points of runs per wicket vs Strike Rate

Fig 2: Runs per over and runs per wicket for the first five wickets for the top nine teams this decade, each data point is one team for one year. Min 25 innings.

Returning to the model, what was it doing wrong? It believed batsmen played the situation, and that 50-2 with two new batsmen was the same as 50-2 with two players set on 25*. Cricket just isn’t played that way. Having upgraded the model to reflect batsmen playing themselves in, now does it believe England could score 373-3 and no-one bat an eyelid? Yes. ODI model 3.0 is dead. Long live ODI model 4.2!

Fig 3: redballdata.com does white ball Cricket. Initially badly, then a bit better.

Still some slightly funny behaviour, such as giving England a 96% chance of scoring 200 off 128 or a 71% chance of scoring 39 off 15. Having said that, this is at a high scoring ground with an excellent top order. Will keep an eye on it.

In Summary, we’ve looked at how higher averages and Strike Rates are correlated, suggested that the mechanism for that is that over a longer innings more time is spent scoring freely, and run that through a model which is now producing not-crazy results, just in time for the World Cup.

*Mostly. Batsmen stop playing themselves in once you are in the last 10 overs. Which means one could look at the impact playing yourself in has on average and Strike Rate. But it’s late, and you’ve got to be up early in the morning, so we’ll leave that story for another day.

**Bit naughty this. I have the data on how batsmen construct their innings, but will be using it for gambling purposes, so don’t want to give it away for free here. Sorry.