
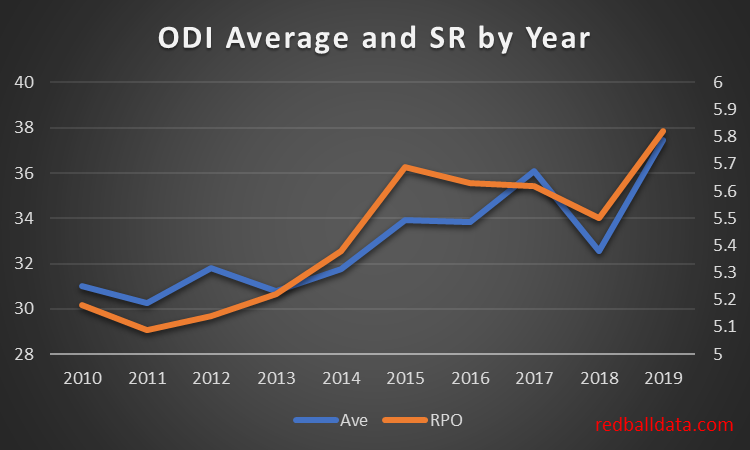
My ODI model was built in those bygone 260-for-six-from-50-overs days. Having dusted it off in preparation for the Cricket World Cup it failed its audition: England hosted Pakistan recently, passing 340 in all four innings. Every time, the model stubbornly refused to believe they could get there. Time to revisit the data.
Dear reader, the fact that you are on redballdata.com means you know your Cricket. Increased Strike Rates in ODIs are not news to you. This might be news to you though – higher averages cause higher strike rates.
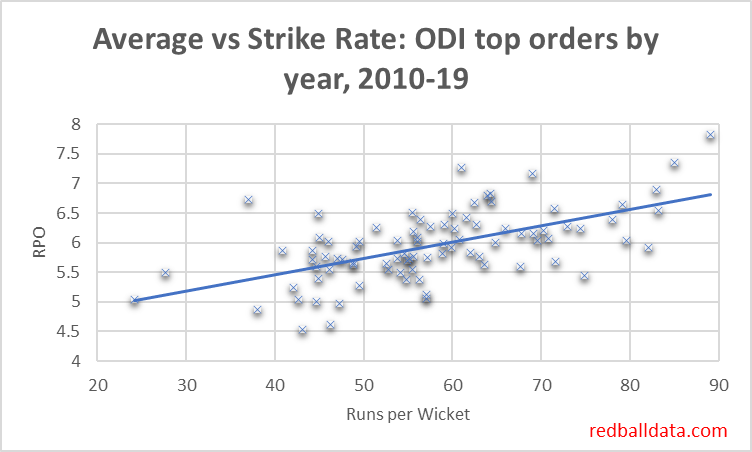
Why should increasing averages speed up run scoring? Batsmen play themselves in, then accelerate*. The higher your batsmen’s averages, the greater proportion of your team’s innings is spent scoring at 8 an over.
Let’s explore that: Assume** everyone scores 15 from 20 to play themselves in, then scores at 8 per over. Scoring 30 requires 32 balls. Scoring 50 needs 46 balls, while hundreds are hit in 84 balls. The highest Strike Rates should belong to batsmen with high averages.
Here’s a graph to demonstrate that – it’s the top nine teams in the last ten years, giving 90 data points of runs per wicket vs Strike Rate
Returning to the model, what was it doing wrong? It believed batsmen played the situation, and that 50-2 with two new batsmen was the same as 50-2 with two players set on 25*. Cricket just isn’t played that way. Having upgraded the model to reflect batsmen playing themselves in, now does it believe England could score 373-3 and no-one bat an eyelid? Yes. ODI model 3.0 is dead. Long live ODI model 4.2!
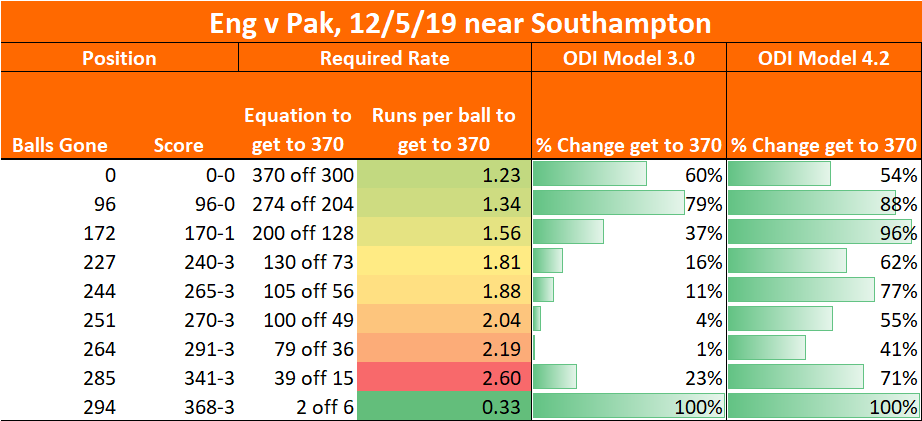
Still some slightly funny behaviour, such as giving England a 96% chance of scoring 200 off 128 or a 71% chance of scoring 39 off 15. Having said that, this is at a high scoring ground with an excellent top order. Will keep an eye on it.
In Summary, we’ve looked at how higher averages and Strike Rates are correlated, suggested that the mechanism for that is that over a longer innings more time is spent scoring freely, and run that through a model which is now producing not-crazy results, just in time for the World Cup.
*Mostly. Batsmen stop playing themselves in once you are in the last 10 overs. Which means one could look at the impact playing yourself in has on average and Strike Rate. But it’s late, and you’ve got to be up early in the morning, so we’ll leave that story for another day.
**Bit naughty this. I have the data on how batsmen construct their innings, but will be using it for gambling purposes, so don’t want to give it away for free here. Sorry.
