Do right-left pairings score faster in ODIs?

Let’s start with the superficial (Boo! Hiss!) – a right-left pair score 0.8 runs per hundred balls faster than a right-right duo.

ODI partnership summary – min 120 balls, top nine teams only, up to 18 June 2020.

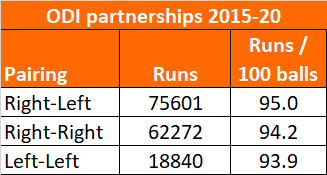
But right-left pairings aren’t something exotic. They are the normal state of affairs. 48% of ODI runs are scored by this combination. No bowler should be phased by normality.

Jarrod Kimber, while concluding that “it’s complicated”, suggested the quicker left-right scoring is a combination of additional wides and ensuring unfavourable spin matchups for the fielding team.

But what about taking into account how quickly players usually score? Gayle, Munro, Morgan are quick scoring left handers, who will be involved in fast scoring partnerships.

I’ve taken each ODI pairing of the last five years and looked at how quickly they should score together – which is the mean of their strike rates. For instance, Sikhar Dhawan (98) and Rohit Sharma (96) would be expected to score 97 runs per hundred balls. Actually, they favoured setting a base, and scored at 86 per hundred balls. No right-left benefit there. However, the Dhawan-Sharma point is anecdotal – the real story is in the general case.

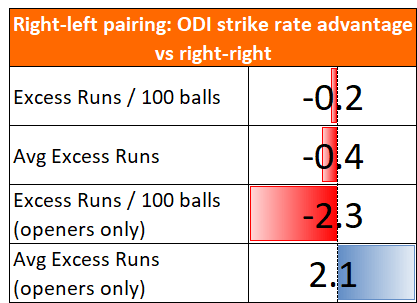
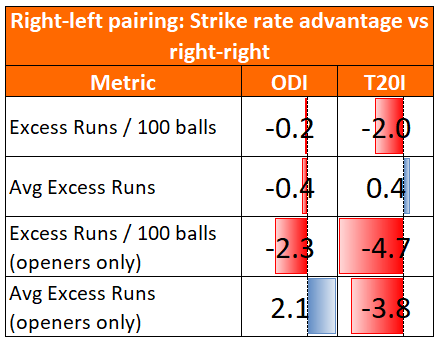
Two ways we can look at this – firstly, excess runs per hundred balls (ie. take all the right-left pairings, compare the runs they scored against expectation based on individual strike rates, and divide by the number of balls bowled). Right-left combinations are weaker than right-right pairs on this metric by 0.2 runs per hundred balls.

Next, because the first method is weighted towards players that batted together lots (Roy-Bairstow’s blitzes have a big impact), we take the raw average of each pairing. For example, Dhawan-Sharma’s impact score is 86 minus 97, being -11 runs per hundred balls. Taking the average for all right-left pairs, they come out 0.4 runs slower per hundred balls than right-right partnerships.

That’s 2-0 to the right-right pairings. Right-left combinations look slower than right-right pairings, once you adjust for who is batting.

But could it be impacted by time of the innings? For instance, do lots of right-left pairs open the batting, so score more slowly at that stage of the innings? Let’s repeat those same two calculations, but just for openers.

Darn it. We have three measures saying right-left pairings are of no benefit, against one saying that they are.

We need more data.

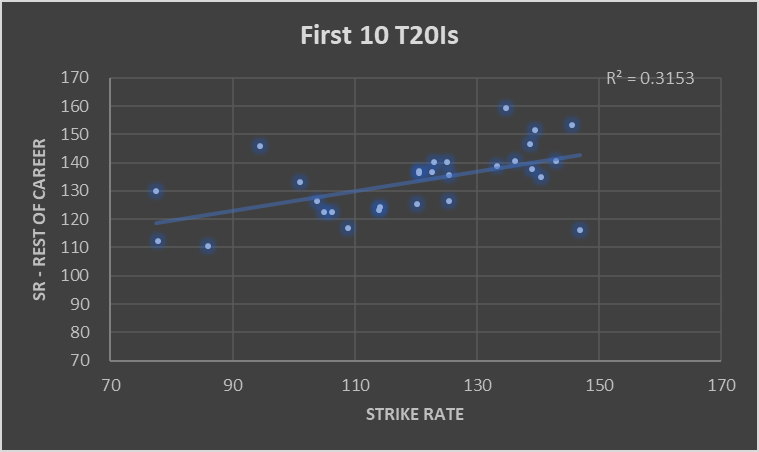
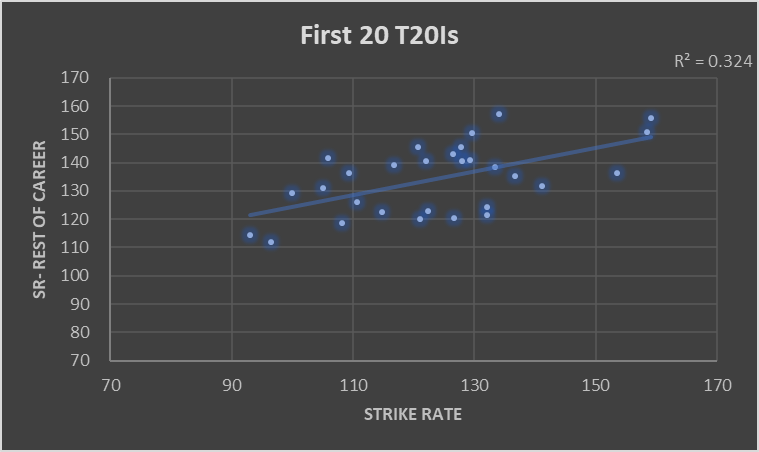
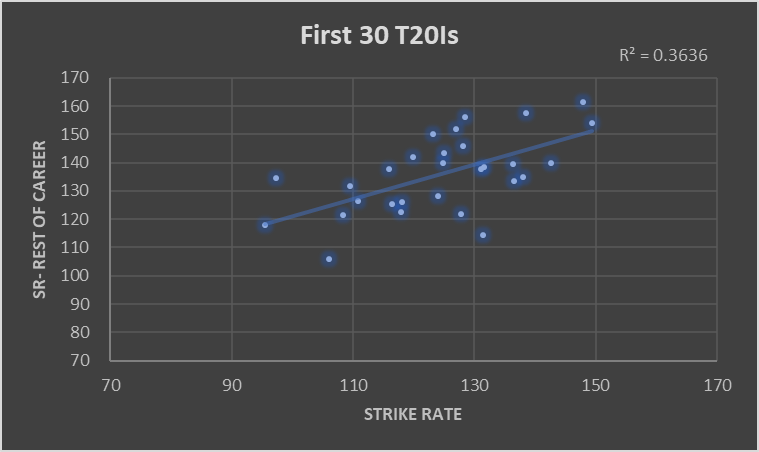
The good news – I’ve finally found a use for all those meaningless T20Is: to test right-left supremacy.

Running the same methodology for 2015-20, it’s nice to see some familiar faces. Dharwan and Sharma top the list, with 1,663 runs together. This time their collective strike rate of 141 is much closer to what we’d expect. And the general case:

Conclusion & Discussion: If anything your team will score faster with two right-handers batting together. Why should that be? One thought: with a left-right combination, the bowler must have a different approach for each batsman, and adopt the optimum lines and lengths for the player on strike. However, with two right handers that isn’t necessary. Is there a risk that a bowler tries to apply the same plan to two quite different right-handed players? I’ve no idea, but it kinda feels possible.

***

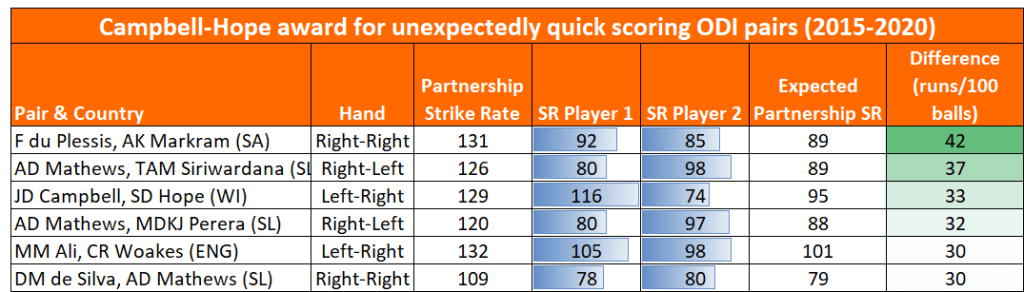
This has all been a bit dry, so let’s have some fun. Firstly, the Campbell-Hope award for the pairings who added up to more than the sum of their parts:

Min 300 runs. Top nine teams only.

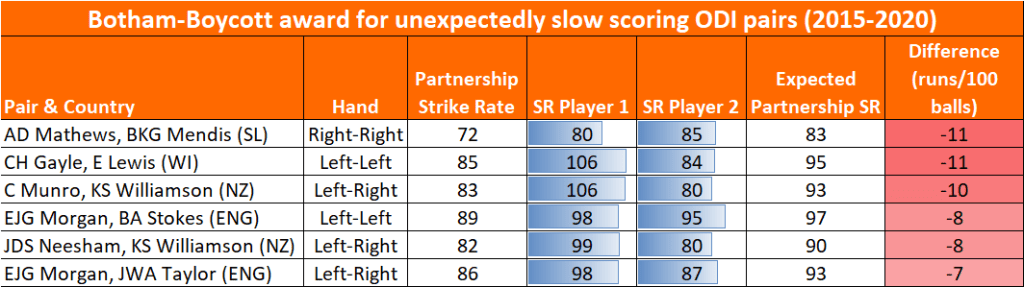
And the same for slow scoring – where two batsmen either don’t gel or happen to have come together to consolidate not dominate:

Min 300 runs. Top nine teams only.

PS. That was supposed to be some harmless trivia. But Angelo had to spoil it. Did you see him in four of the twelve pairings? Another hypothesis to test: “Is Angelo Mathews better with some players than others”?

Further readingCricinfo analysis of ODI partnership averages. Concluded no advantage to left-right partnerships. Doesn’t cover strike rates though – so I may have done something original here.

How many innings before we can accurately predict T20I Strike Rate?

Last time I looked at how long it takes for averages to mean something. Thought I’d try the same analysis for 20-20 Strike Rates. How long before a player’s 20-20 SR is a fair representation of that player?

Play for long enough and a batsman’s Strike Rate reflects their ability. However, in the early stages their career Strike Rate will be volatile as the sample is small. One significant factor is the impact of average on Strike Rate: most innings accelerate as they go on, so one big score early on will give a player a temporarily favourable career SR.

The below chart shows T20I Strike Rates for all players with 60+ Innings since 2009, split by their first ten, twenty or thirty innings (x axis) and then subsequent innings (y axis). Note that the acceleration in T20 scoring in recent years means most players scored faster in their later innings.

Consider the players who had a SR of 130 in their first 30 innings: one (Dilshan) stuttered and struck at 114 afterwards. Another (Nabi) scored at 156 per hundred balls in subsequent T20Is. If you have a player that has scored at eight an over in their first 30 innings, you may only know that they’ll score at between seven and nine per over from then on. Not very insightful.

Tom Banton has a T20 SR of 160 after 25 dismissals. That’s too few innings to be confident in him maintaining that scoring rate, but enough to say he’s probably a 140+ SR batsman.

Another recent example comes from Dawid Malan:

I don’t know what else I can do to break into the team for the T20 World Cup. I don’t know how you can be under pressure with an average over 57 and a strike rate over 150

Dawid Malan, Sky Sports Cricket Blog

Malan has done very well in his nine T20Is. Yet that tells us little about how we would expect him to perform in the future. Fortunately, T20 players get a lot of stamps in their passports- Malan scored at 145 per 100 balls in the Banglasdesh Premier League and 148 in the most recent Blast. It’s just a case of doing the legwork to calculate an expected Strike Rate at international level. I’ll leave it to the T20 experts to work out whether Malan is worth a spot in the World Cup squad.

Of England’s current players, only Roy and Morgan have more than 30 completed innings in T20Is. There’s insufficient international data. Yet most batsmen have played over 100 innings in T20 leagues – plenty to have a good read on them.

Summing up, there’s too few T20Is to use them to set expected average/strike rate in later T20Is. Far better to set this expectation based on club stats, adjusted for difficulty. There’s even enough data to weight analysis towards more recent performances. Also, beware small sample sizes: even 30 completed innings are too few. Anything under 100 innings and you should apply some judgement to the data.

The ODIs they are a’changing

My ODI model was built in those bygone 260-for-six-from-50-overs days. Having dusted it off in preparation for the Cricket World Cup it failed its audition: England hosted Pakistan recently, passing 340 in all four innings. Every time, the model stubbornly refused to believe they could get there. Time to revisit the data.

Dear reader, the fact that you are on redballdata.com means you know your Cricket. Increased Strike Rates in ODIs are not news to you. This might be news to you though – higher averages cause higher strike rates.

Fig 1: ODI Average and Strike Rate by Year. Top 9 teams only. Note the strength of correlation.

Why should increasing averages speed up run scoring? Batsmen play themselves in, then accelerate*. The higher your batsmen’s averages, the greater proportion of your team’s innings is spent scoring at 8 an over.

Let’s explore that: Assume** everyone scores 15 from 20 to play themselves in, then scores at 8 per over. Scoring 30 requires 32 balls. Scoring 50 needs 46 balls, while hundreds are hit in 84 balls. The highest Strike Rates should belong to batsmen with high averages.

Here’s a graph to demonstrate that – it’s the top nine teams in the last ten years, giving 90 data points of runs per wicket vs Strike Rate

Fig 2: Runs per over and runs per wicket for the first five wickets for the top nine teams this decade, each data point is one team for one year. Min 25 innings.

Returning to the model, what was it doing wrong? It believed batsmen played the situation, and that 50-2 with two new batsmen was the same as 50-2 with two players set on 25*. Cricket just isn’t played that way. Having upgraded the model to reflect batsmen playing themselves in, now does it believe England could score 373-3 and no-one bat an eyelid? Yes. ODI model 3.0 is dead. Long live ODI model 4.2!

Fig 3: redballdata.com does white ball Cricket. Initially badly, then a bit better.

Still some slightly funny behaviour, such as giving England a 96% chance of scoring 200 off 128 or a 71% chance of scoring 39 off 15. Having said that, this is at a high scoring ground with an excellent top order. Will keep an eye on it.

In Summary, we’ve looked at how higher averages and Strike Rates are correlated, suggested that the mechanism for that is that over a longer innings more time is spent scoring freely, and run that through a model which is now producing not-crazy results, just in time for the World Cup.

*Mostly. Batsmen stop playing themselves in once you are in the last 10 overs. Which means one could look at the impact playing yourself in has on average and Strike Rate. But it’s late, and you’ve got to be up early in the morning, so we’ll leave that story for another day.

**Bit naughty this. I have the data on how batsmen construct their innings, but will be using it for gambling purposes, so don’t want to give it away for free here. Sorry.