Does cricket lose something when we are dispelled of its myths? Some fictions are unhelpful, such as Michael Vaughan’s success without having thrived at county level. However, we like to believe in partnerships: every smile and punch of gloves boosting the batting of our heroes, spurring them on to greater heights.
Thus I write hesitantly – I am loathe to reduce cricket to a spreadsheet, even though I literally do that. Hopefully some unsolved X factors will remain after the stats revolution.
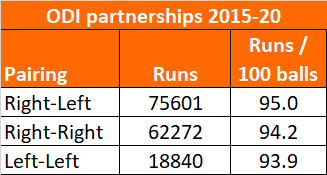
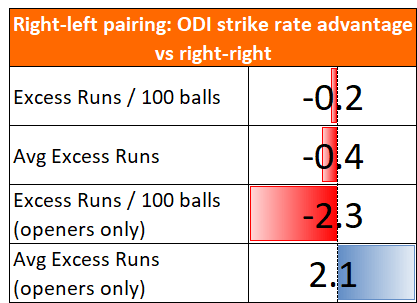
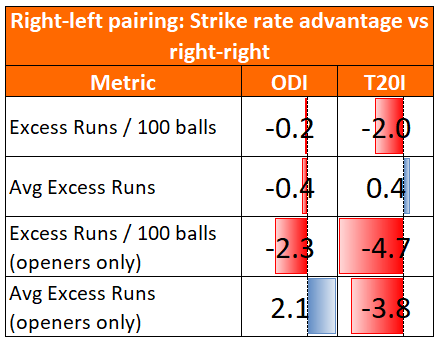
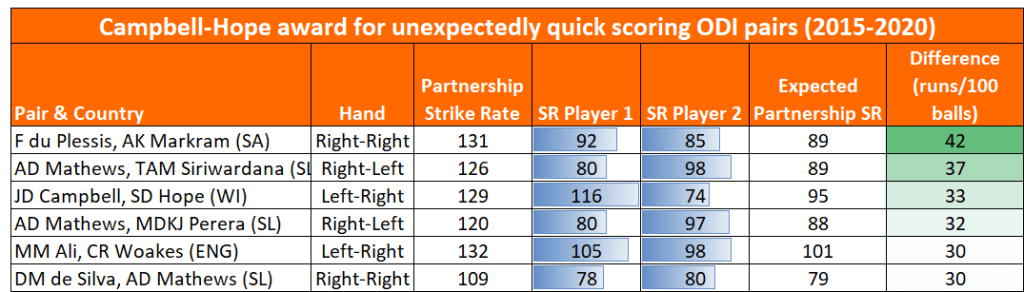
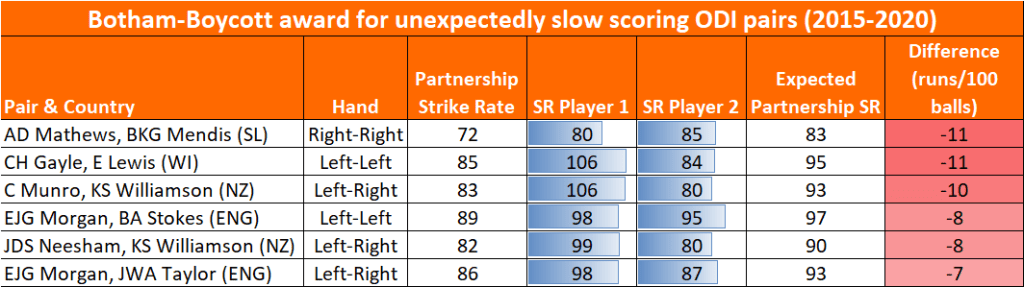
On to today’s topic. Last time we saw that right-left partnerships don’t influence white ball run rate. This post covers the currency of red ball cricket: averages. Does who you’re batting with impact your average?
Considering the period 2010 to today, seven pairs performed much better than expected based on the records of the individuals in that partnership. Two pairs performed worse. They are shown below, ordered by how surprising that out-performance is.
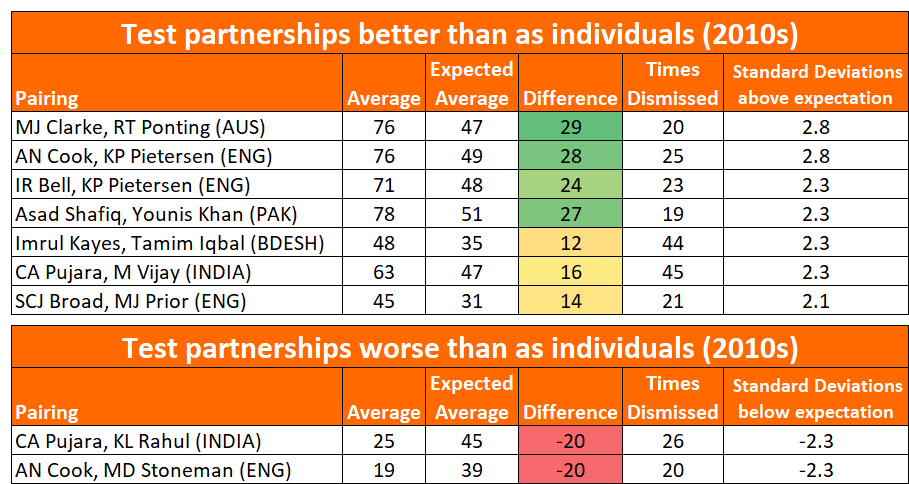
That’s nine outliers – seven good and two bad.
But what are the chances each outlier was just fluke? After all, Clarke & Ponting only had 20 partnerships in the 2010s. After this analysis of error bars on averages we have a way to answer that – by quantifying how likely it is that a specific average (eg. Jermaine Blackwood averaging 37 in England) is arrived at by chance, based on the sample size.
With 120 partnerships (min 20 innings) since 2010, we would expect six pairs to lie two standard deviations from expected average. Actually we have nine. On the face of it, that’s evidence that some duos do get a boost from batting together. However, two of the nine drop off the list with further scrutiny. Kayes and Iqbal happened to bat together more at home than away. Bell/Pietersen somehow had 19 of their 23 partnerships in the first innings. Adjust the calculations to reflect that, and we have seven outliers, whilst by chance we would expect to have six. In layman’s terms, if each duo batted together enough times, their partnership average would eventually reach their combined average.
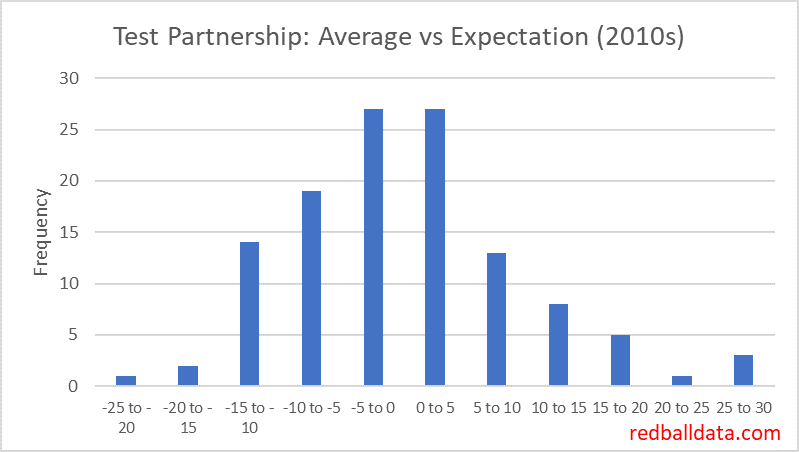
Here’s the chart of all 120 players, plotting variance to expectation against frequency. Even with small sample sizes, most partnerships average within five runs of expectation.
Where does this leave us? Remembering that “absence of evidence is not evidence of absence“, the jury’s deliberations will continue, but they will now be leaning in favour of specific partnerships not making a significant impact on a player’s average. Cricket is a one on one sport, bowler against the batsman on strike.
***
PS. How did I arrive at the expected average for a partnership? Start with the mean of the post-2010 average of the two players in each partnership. Add 1.5 runs for any partnership that isn’t two openers, on the basis that one of the batsmen will start the partnership with their eye-in. Add 4.6% for the extras that would be scored in that innings. It’s a slightly different formula for when a senior batsman is with a tailender.
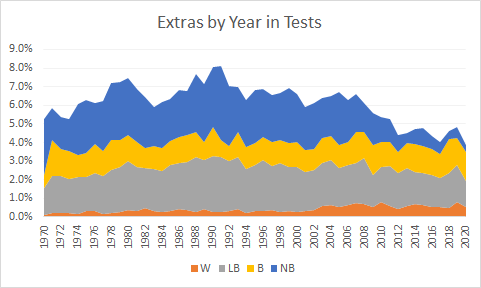
PPS. Why the cut-off in 2010? “No balls” dropped off then. Here’s the 50 year history of extras in Test cricket. Extras count towards partnership totals, so the maths gets more involved when extras vary significantly by year.