Last time I looked at how long it takes for averages to mean something. Thought I’d try the same analysis for 20-20 Strike Rates. How long before a player’s 20-20 SR is a fair representation of that player?
Play for long enough and a batsman’s Strike Rate reflects their ability. However, in the early stages their career Strike Rate will be volatile as the sample is small. One significant factor is the impact of average on Strike Rate: most innings accelerate as they go on, so one big score early on will give a player a temporarily favourable career SR.
The below chart shows T20I Strike Rates for all players with 60+ Innings since 2009, split by their first ten, twenty or thirty innings (x axis) and then subsequent innings (y axis). Note that the acceleration in T20 scoring in recent years means most players scored faster in their later innings.
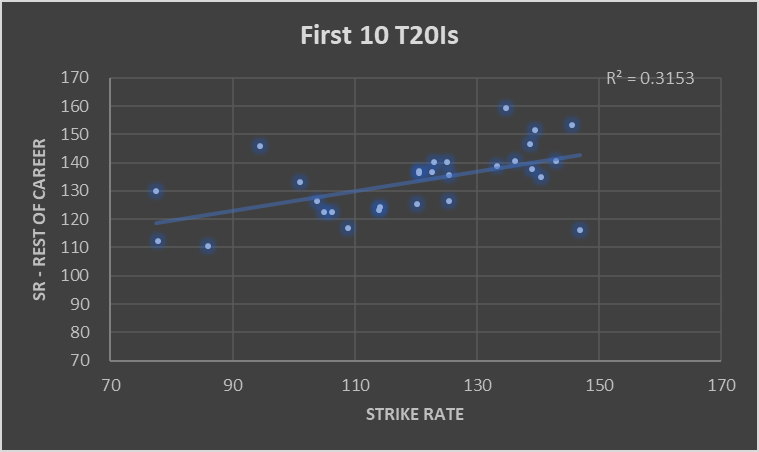
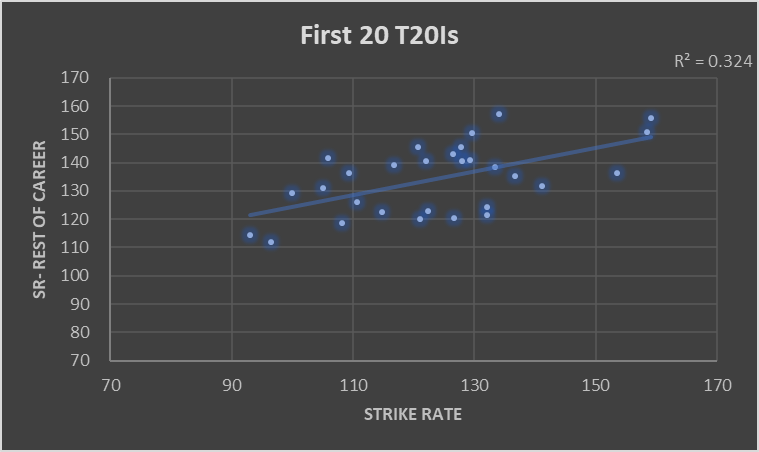
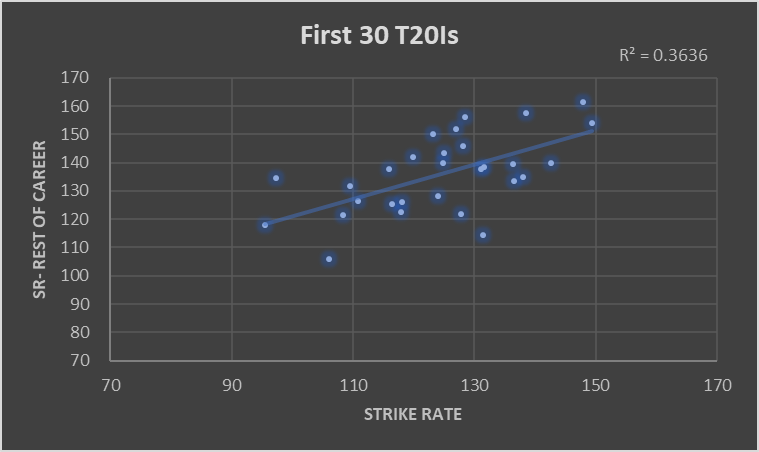
Consider the players who had a SR of 130 in their first 30 innings: one (Dilshan) stuttered and struck at 114 afterwards. Another (Nabi) scored at 156 per hundred balls in subsequent T20Is. If you have a player that has scored at eight an over in their first 30 innings, you may only know that they’ll score at between seven and nine per over from then on. Not very insightful.
Tom Banton has a T20 SR of 160 after 25 dismissals. That’s too few innings to be confident in him maintaining that scoring rate, but enough to say he’s probably a 140+ SR batsman.
Another recent example comes from Dawid Malan:
I don’t know what else I can do to break into the team for the T20 World Cup. I don’t know how you can be under pressure with an average over 57 and a strike rate over 150
Dawid Malan, Sky Sports Cricket Blog
Malan has done very well in his nine T20Is. Yet that tells us little about how we would expect him to perform in the future. Fortunately, T20 players get a lot of stamps in their passports- Malan scored at 145 per 100 balls in the Banglasdesh Premier League and 148 in the most recent Blast. It’s just a case of doing the legwork to calculate an expected Strike Rate at international level. I’ll leave it to the T20 experts to work out whether Malan is worth a spot in the World Cup squad.
Of England’s current players, only Roy and Morgan have more than 30 completed innings in T20Is. There’s insufficient international data. Yet most batsmen have played over 100 innings in T20 leagues – plenty to have a good read on them.
Summing up, there’s too few T20Is to use them to set expected average/strike rate in later T20Is. Far better to set this expectation based on club stats, adjusted for difficulty. There’s even enough data to weight analysis towards more recent performances. Also, beware small sample sizes: even 30 completed innings are too few. Anything under 100 innings and you should apply some judgement to the data.