MalAnalysis

Could Dawid Malan make a Test comeback? Tim Wigmore at The Daily Telegraph thinks so.

I’d sort of written him off – his expected Test average is 29 (based on the last four years’ red ball data). Malan will be 34 by the time the next Ashes comes round, an age where most batsmen are on the way down.

But he is at the top end of English batsmen. To choose between this clump of high-20s-low-30s batsmen we need to ask ourselves who is most likely to perform in Australia?

You can be pretty sure of the attack (Starc, Hazlewood, Cummins, Lyon). That means you need talented batsmen who are also confident against LF, RFM, RF, OS. You also need batsmen who would be suited to Australian conditions. Let’s measure Malan against those requirements:

Talent

Malan’s red ball numbers (1,005 runs at 48 in Div 2 2019 then 332 runs at 66 last year) are pretty good, but not indicative of a sparkling Test career (D2 is about 40% easier to bat in than Tests, the Bob Willis Trophy 30% easier). Malan is good enough that a summer averaging 50 might edge him past the competition.

Ashes Matchups

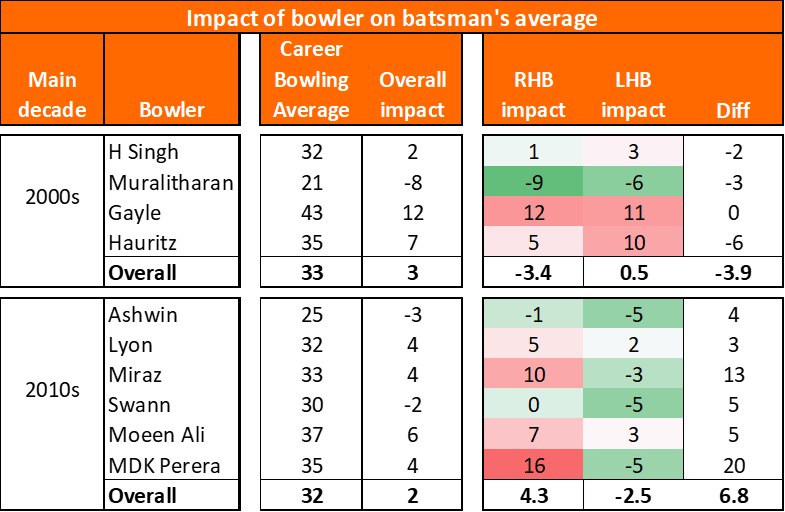
We can see his Test record, splitting bowlers by type. However, he’s only played 15 Tests. Ideally we’d have county stats to back this up. I don’t have that – so we’ll need to use something else.

This might be wrong, but I’m going to include Malan’s stats from T20/T20I to get a better view of his ability against different bowling types. Rather than measuring average for T20, I’ll use Strike Rate – since that’s what batsmen are judged on.

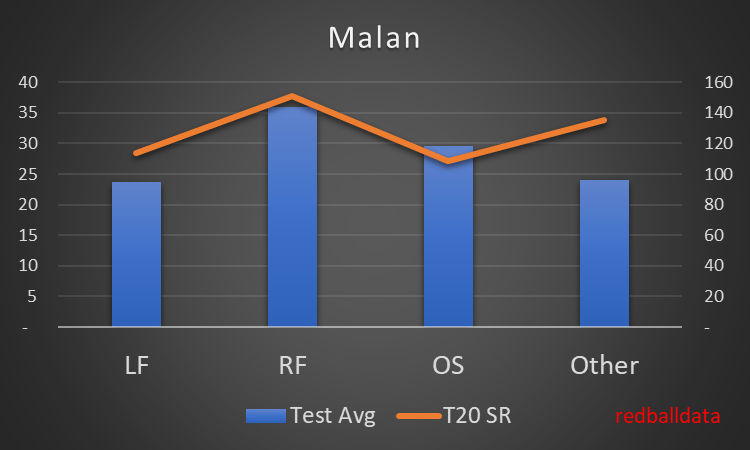
  • Left Arm Fast: A possible weak spot. Averaging 24 in Tests isn’t too worrying in isolation (it’s only four dismissals). But add in the 114 SR in T20 and there’s more than a hint of a weakness.
  • Right Arm Fast: Solid stats.
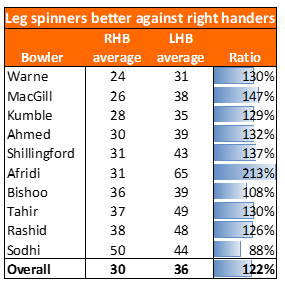
  • Off Spin: We know that as a left hander, facing offspin will be relatively challenging. After five dismissals Malan has done OK. But his T20 stats (SR 108) say it’s a relative weakness.

Australian conditions

Possibly a bit better than his overall record? 383 runs at 43 in Tests, but SR of 114 in the Big Bash last winter.

Overall, Dawid Malan would be a gamble for 2021 Ashes selection. A possible weakness against Left Arm Fast and Off Spin could leave him exposed.

But, there’s a summer between now and then. When we get closer to the Ashes we can consider who the best options are for each spot in the batting order.

Appendix

The most interesting thing about the above analysis is the hypothesis that matchups can carry over from red to white ball cricket. It doesn’t prove anything, but I had a look at a couple of other players.

Root is great against OS. He’s weakest against RF in all formats.
Bairstow does not like fast bowling.

Off spinners, DRS, Left Handers, and a new way of looking at averages

How can you tell if a bowler is better than average? They cause batsmen to underperform.

Muttiah Muralitharan troubled batsmen to the extent they averaged eight runs per wicket fewer than over their careers. Mark Boucher averaged a paltry 21 against Murali, whilst his career average was 30.

So what? Well, dear reader, the title of the piece gives you a clue where this is going.

***

DRS was first used in a Test match in 2008, and subsequently rolled out at the back end of 2009. This led to an increase in LBWs for spinners as the technology changed perceptions of how often spinners were delivering balls that would hit the stumps.

Fig 1 – percentage of bowled and LBW for leading off spinners this century (excludes Jeetan Patel, who evenly spanned both decades).

The chart shows a notable increase in the proportion of bowled and LBW dismissals for spinners in the 2010s.

Fig 1 indicates that off spinners only got a little benefit from DRS. This makes sense: coming over the wicket they can’t bowl too straight as that opens up run scoring opportunities. Turning the ball in to the right hander from outside off gives the batsman an escape route (by ensuring contact with the pad is outside the line of the stumps).

Now look at the left handers. A revolution. Instead of 30% of wickets coming from bowled/LBW, that rocketed to 45%. A simple post-DRS approach for an off spinner is to come round the wicket to a left hander and pitch on off stump. Any big turn catches the edge; while no turn means bowled/LBW are in play. Pre-DRS left handers had the opportunity to get a good stride in and using the pad as first line of defence. That doesn’t work with ball tracking. The camera knows.

***

UPDATE 31st JAN 2020 – In the below table, columns “RHB impact” and “LHB impact” were based on potentially inaccurate data. I need to do more work to prove this – so please don’t rely on it for now.

Fig 2

Fig 2 is a ruddy goldmine. Let’s break it down.

  • First two columns: the player and the decade they mainly played in
  • Third column: career average
  • Fourth column: impact on the averages of the batsmen they bowled to. The better the bowler, the lower this number would be. For an average Test cricketer this number would be nil. Calculated by comparing (runs conceded against each batsman) to expected runs conceded (wickets taken * batsman’s average).
  • Fifth to seventh columns split the Bowler Impact metric between right and left handed batsmen

In the 2000s, left handers were the batsmen of choice to counter a strong off spinner. Only thee batsmen averaged more than 52 against Muralitharan – all were left handers*. A left hander against Murali could expect to average three runs more than his right handed equivalent.

However, that benefit reversed last decade. The hunter has become the hunted. Swann and Ashwin didn’t adversely affect right handers’ averages, but lopped five runs per innings from left handers.

That point is really interesting, so I’ll say it again another way. It’s wrong to see Graeme Swann as a very good Test bowler against everyone – he was average against right handers yet brilliant against lefties. That averages out to “very good”.

Conclusions

  • A bowler’s ability can be represented by their impact on a batsman’s average, as an alternative metric to bowling average.
  • Off spinners represent a clear and present danger to left handers.
  • The general case for matchups in Tests: RHB +8%, LHB -13% vs Off Spin. RHB -7%, LHB +14% vs Leg Spin.
  • Previously I’d adjusted a batsman’s expected average to reflect the bowling attack’s averages. Will need to add to that the type of bowler and whether the batsman is left or right handed.
  • I’m working on the basis that all off spinners are alike – explicitly assuming relative performances of right/left handers against a particular bowler are the result of low sample sizes.
  • Will look at left arm pace and slow left arm bowlers next.

*Qualification criteria: dismissed four or more times

Further reading

Ricky Ponting argued for Australia to favour right handers in the 2019 Ashes to nullify the threat of Moeen Ali.

Leg spin: What we can learn from Statsguru

My statistical goal is a theory of everything: expected averages for any situation. So far I’ve excluded the influence of match ups (specific bowler vs batsman) as being Very Difficult Indeed. That ends now: join me as I dip a toe into that field, starting with some analysis of leg spinners in Tests.

**Update 24/04/2020 – the methodology below was flawed: the Statsguru page I used reflects the score a batsman was on when dismissed, rather than the head-to-head score. Interestingly, after further work it looks like the conclusions were reasonably accurate, even if the workings weren’t.**

1. Leg spinners and favour right handers

The logic for it being more expensive to bowl leg spin (LS) against left handed batsmen (LHB) in white ball cricket is that the batsman can play with the spin, and minor errors in line provide opportunities for scoring. Here’s CricViz on that topic.

In longer format cricket, I expected leg spinners to be agnostic to the batsman’s stance. Against right handers (RHB) a straight line threatens every kind of dismissal apart from timed out, while for LHB a line well outside off can still threaten the stumps and both edges, while asking the batsman to play well away from their body.

What does the data show? At the highest level of Test Cricket, nine of the ten leg spin bowlers sampled favour right handers. Expect a leggie to average 22% more against left handers in Tests.

Shane Warne took 708 Test wickets at 25, yet against LHB he was average. Still, that makes him significantly better than his competitors – none of the other recent leg spin bowlers averaged under 35 against LHB. What’s the reason? I think it’s the required line against left handers making bowled and LBW less likely. Against right handers bowled and LBW make up 37% of dismissals. For left handers that drops to 31%.

2. Elite leg spinners come into their own against the tail

There’s a neat split between Warne, MacGill, Kumble, Ahmed and the rest. The top four took 1,742 wickets at 28, while the other six took their wickets at 39. Individually, there’s not enough data on the six lesser players – so I’ve lumped them together to compare their careers to the elite four.

The ratio of Elite vs Second Rate averages reveals the trend: Elite leg spinners bamboozle lower order batsmen (anyone with a career average under 20).

What does this mean for strategy? Captains will intuitively know that a strong leg spinner is an asset against the tail. If you have an inferior leg spinner, how should you deploy them? I would argue they are best used against the top order (once the ball is no longer new), in order to keep the best bowlers fresh. It’s a question of managing resources and getting the best out of the attack over a 90 over day.

3. Elite bowlers are flattered by bowling at weaker batsmen

The weaker leg spinners claimed 58% of their wickets against batsmen who average 30+. For the elite four that figure is just 51%.

The above impact can flatter averages; for instance Stuart MacGill (42% wickets against top order, career average 29) was not so much better than Devendra Bishoo (61% wickets against top order, career average 37).

A full system would include this when rating bowlers: a rough estimate says MacGill’s true rating was 31, whilst Bishoo’s true average was 35. A quick check shows these adjusted averages are more in line with FC averages, indicating there’s a ring of truth to this.

Methodology

I’ll level with you – there are some assumptions here. Cricinfo’s excellent and free data gives a bowler’s averages split by batsmen (here’s MacGill’s). However, this doesn’t cover how many runs were conceded against batsmen who they haven’t dismissed. I’ve attributed the unallocated runs to batsmen in proportion to their average and number of matches played against that bowler.

***

That was fun! We’ve seen a hint of what matchups can do and I’m very late to the party. That said, I’ll stick to my guns: most patterns are just data mining and we need proper evidence (at the level of the above or better) before drawing conclusions. Those conclusions are best done at the “off spinner vs opening batsman” level rather than the “Moeen Ali to Dean Elgar” level.

Matchups and Opportunity Cost

There’s a theory (which I just invented) that you could listen to old radio broadcasts of Cricket and be able to judge the date by the buzzwords of the era. For 2019, it’s “Matchups”: pitting bowlers against the optimum batsmen to stifle run scoring and take cheap wickets.

Matchups seem like a plausible proposition – get enough data, find some patterns, check you’ve got a decent sample size and out will pop some options to consider. Note the need for a plausible proposition (ie. not “Roy struggles against the flipper in the top of the hour when the bowling is from the North-West”).

There are three issues I have with the use of Matchups.

Firstly, they aren’t publicly available – if a pundit refers to X having a weakness against a particular type of bowling, the viewer/listener has no way of knowing if that’s a fact or an opinion. In times gone by, we could accept that all such utterances were opinions, and who better to go to for opinions than people who report on the game for a living? The balance has shifted – so now when hearing “Bairstow struggles against spin early in the innings”, it could be opinion, bad data*, or a solid piece of analysis. There’s something unsatisfying about that.

Secondly, we don’t know if Matchups work. If each one is a hypothesis, it should be easy to aggregate them in order to compare results and expectation. I expect much of this is – understandably – happening behind closed doors. My hunch is also that many Matchups evaporate as statistical flukes, so are of no benefit. If you’re aware of a rigorous assessment of Matchups, please do drop me a line on twitter or via the Contact page on this site.

Finally, and of relevance to the Cricket World Cup, there’s an opportunity cost associated with changing bowling plans. Especially in ODIs where bowlers need rest during an innings.

Let’s explore that Opportunity Cost – what are the downsides of opening with spin? We can expect more teams to open with spin against England after Bairstow fell first ball against Imran Tahir. Here’s how South Africa used their bowling resources that day:

Fig 1: Overs bowled by each player

Early wickets have a big impact on expected score – but one cannot fully appraise the impact of opening with Tahir without taking all factors into account.

  • Rabada didn’t get the new ball. He then had to condense 10 overs into 44, rather than across 50 – does that impact the pace he can bowl?
  • After 24 overs, with the score on 131-3, Faf du Plessis threw the ball to JP Duminy. Five of the next eight overs were bowled by Duminy and Markram. On this occasion it worked – 5-0-30-0 is not too bad. But it’s the big picture that matters, not one innings.
  • Pretorius only bowled seven overs, Phehlukwayo eight. Without a medium pacer or second spinner than can bowl 10 overs in a row, once a team opens with spin, they are probably going to underuse their fourth and fifth bowler.

What are the factors to consider when weighing up whether to open with a spinner in a four pace / one spin attack?

  1. Will it work? What is the increase in chance of a wicket versus the default option?
  2. What are the relative strengths of your sixth (and possibly seventh) best bowlers, compared to your fourth and fifth?
  3. How fit is the bowler who won’t now be opening? Are you confident they can bowl 10 out of 44 overs? How many days since your last game?

What have we learned? The value of a Matchup is the expected gain from one pairing over another, less the downsides of changing the bowling order to accommodate using a specific bowler at a particular time.

* A word on bad data: Andrew Strauss averaged 91.5 against Mitchell Johnson in Tests. It’s a nice piece of trivia, but it’s only based on Strauss scoring 183-2 against Johnson. I doubt this would have much predictive power. Using that as a basis of prediction is roughly the equivalent of writing off Graham Gooch after he bagged a pair on debut.

Further reading: Cricmetric.com claims to have Matchup data for Batsmen vs Bowlers – I’ve no reason to doubt their data.