
How can you tell if a bowler is better than average? They cause batsmen to underperform.
Muttiah Muralitharan troubled batsmen to the extent they averaged eight runs per wicket fewer than over their careers. Mark Boucher averaged a paltry 21 against Murali, whilst his career average was 30.
So what? Well, dear reader, the title of the piece gives you a clue where this is going.
***
DRS was first used in a Test match in 2008, and subsequently rolled out at the back end of 2009. This led to an increase in LBWs for spinners as the technology changed perceptions of how often spinners were delivering balls that would hit the stumps.

The chart shows a notable increase in the proportion of bowled and LBW dismissals for spinners in the 2010s.
Fig 1 indicates that off spinners only got a little benefit from DRS. This makes sense: coming over the wicket they can’t bowl too straight as that opens up run scoring opportunities. Turning the ball in to the right hander from outside off gives the batsman an escape route (by ensuring contact with the pad is outside the line of the stumps).
Now look at the left handers. A revolution. Instead of 30% of wickets coming from bowled/LBW, that rocketed to 45%. A simple post-DRS approach for an off spinner is to come round the wicket to a left hander and pitch on off stump. Any big turn catches the edge; while no turn means bowled/LBW are in play. Pre-DRS left handers had the opportunity to get a good stride in and using the pad as first line of defence. That doesn’t work with ball tracking. The camera knows.
***
UPDATE 31st JAN 2020 – In the below table, columns “RHB impact” and “LHB impact” were based on potentially inaccurate data. I need to do more work to prove this – so please don’t rely on it for now.
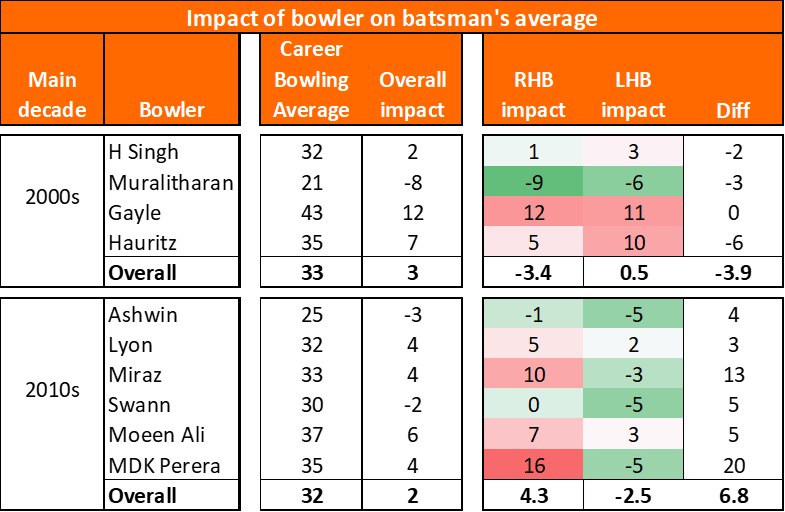
Fig 2 is a ruddy goldmine. Let’s break it down.
- First two columns: the player and the decade they mainly played in
- Third column: career average
- Fourth column: impact on the averages of the batsmen they bowled to. The better the bowler, the lower this number would be. For an average Test cricketer this number would be nil. Calculated by comparing (runs conceded against each batsman) to expected runs conceded (wickets taken * batsman’s average).
- Fifth to seventh columns split the Bowler Impact metric between right and left handed batsmen
In the 2000s, left handers were the batsmen of choice to counter a strong off spinner. Only thee batsmen averaged more than 52 against Muralitharan – all were left handers*. A left hander against Murali could expect to average three runs more than his right handed equivalent.
However, that benefit reversed last decade. The hunter has become the hunted. Swann and Ashwin didn’t adversely affect right handers’ averages, but lopped five runs per innings from left handers.
That point is really interesting, so I’ll say it again another way. It’s wrong to see Graeme Swann as a very good Test bowler against everyone – he was average against right handers yet brilliant against lefties. That averages out to “very good”.
Conclusions
- A bowler’s ability can be represented by their impact on a batsman’s average, as an alternative metric to bowling average.
- Off spinners represent a clear and present danger to left handers.
- The general case for matchups in Tests: RHB +8%, LHB -13% vs Off Spin. RHB -7%, LHB +14% vs Leg Spin.
- Previously I’d adjusted a batsman’s expected average to reflect the bowling attack’s averages. Will need to add to that the type of bowler and whether the batsman is left or right handed.
- I’m working on the basis that all off spinners are alike – explicitly assuming relative performances of right/left handers against a particular bowler are the result of low sample sizes.
- Will look at left arm pace and slow left arm bowlers next.
*Qualification criteria: dismissed four or more times
Further reading
Ricky Ponting argued for Australia to favour right handers in the 2019 Ashes to nullify the threat of Moeen Ali.
