As the internet matures, the amount of freely available data has reduced. So I was excited when this popped up on twitter:
Here’s a database of of 3369 DRS calls from 327 Tests spanning from 2011 to 17 Dec 2020.
— Himanish Ganjoo (@hganjoo153) December 27, 2020
Some Tests are missing because of inconsistent data.https://t.co/WLys3f06RX
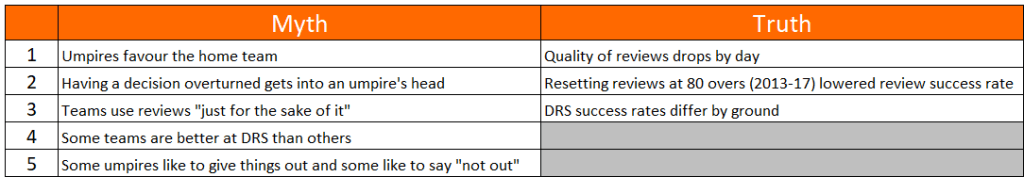
A chance to examine some of the received wisdom on the review system. I’ve got five myths and three trends to share with you.
Before we get into that, a summary. Over the decade of Decision Reviews, most reviews have been by the fielding team (57%). However, batsmen have had greater success overturning dismissals (35%, compared to 21% for the fielding team). The 907 overturned decisions are 6% of the wickets over the last decade, so while umpires are getting the overwhelming majority of decisions right, DRS is making a noticable difference to the accuracy of umpiring.
On with the show. Firstly, five myths:
I’m going to have to ask you to reverse your opinions
Myth 1 – Umpires favour the home team
Crunching the numbers, the hosts and visitors have uncovered almost exactly the same number of incorrect and borderline decisions. In terms of overturned decisions it’s 416-413 in favour of the home team, while the marginal decisions that haven’t been overturned (“Umpire’s Call”) have benefitted the home team slightly, with 109 reviews by the visitors being adjusted Umpire’s Call, against 100 for the home team.
If umpires were being influenced by the crowd, there would be more decisions against the away team then being overturned – this isn’t happening, so whatever home advantage is in Cricket, it’s not from umpires.
Myth 2 – Having a decision overturned gets into an umpire’s head
I took each example of an umpire who had a decision overturned, and looked at the next DRS review for that umpire on the same day in the same innings. If umpires were trying (even subconsciously) to even things up, you’d expect the umpire to give the next close one out, which the batsman would review. Putting this in terms of data, we’d look for a decision overturned against team A to be followed by a review by team B.
No evidence for this exists – of the 449 times when a decision was overturned and another review occurred on the same day, same innings, same umpire, 235 were the other side reviewing, 214 the same side. Umpires are considering each ball on its merits.
Myth 3 – Teams use reviews “just for the sake of it”
This one really surprised me. I’d expected to need to cleanse the data of the pointless reviews at the end of an innings when there’s no harm in reviewing. So I looked for those pointless reviews, but they don’t exist.
Opportunistic reviews should be visible by a dire success rate. Here’s the split of success rate by the batsman’s average:

Maybe a handful of spurious reviews from the worst batsmen, but they aren’t taking the mickey.
Myth 4 – Some teams are better at DRS than others
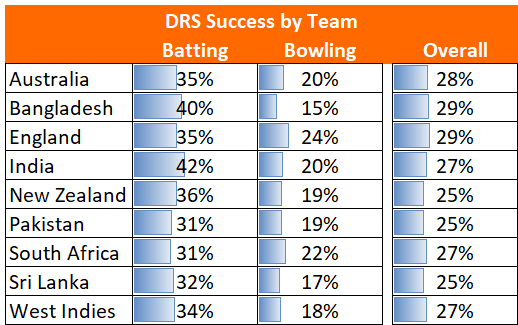
Not true – all the teams are very tightly bunched. I’ve excluded Afghanistan (30%), Ireland (50%) and Zimbabwe (30%) as they just haven’t played enough.
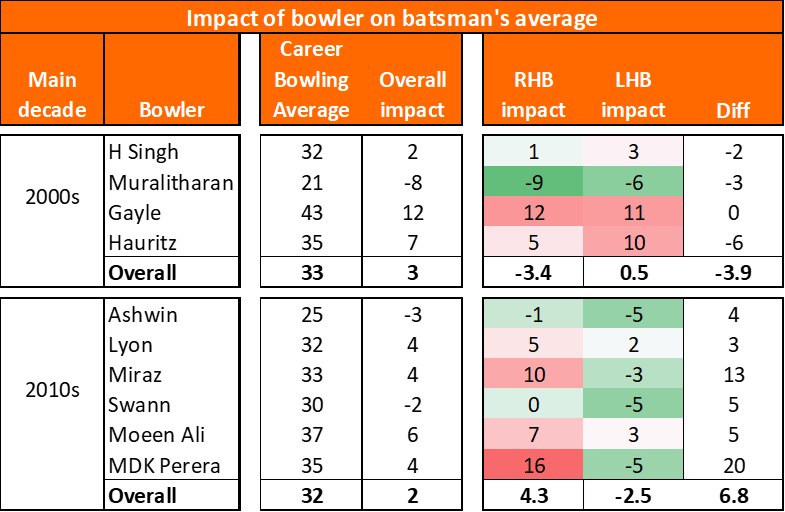
Myth 5 – Some umpires like to give things out and some like to say “not out”
There are two ways this would manifest itself for Outers: “Umpire’s Call” would tend to be batsmen reviewing balls, clipping the stumps, that were given out; and the proportion of successful reviews would be higher for batsmen.
Because of the small sample sizes, it looks like there are trends, but when you put the two methodologies side by side, the pattern disappears. Which is a shame, because I’d hoped that the umpires who were bowlers would be Outers and those that were batsmen would be Not Outers. Turns out Elite Umpires are just professionals. Here’s the chart for good measure.

Now for the true trends
Stay with your original opinions; you’re on screen now.
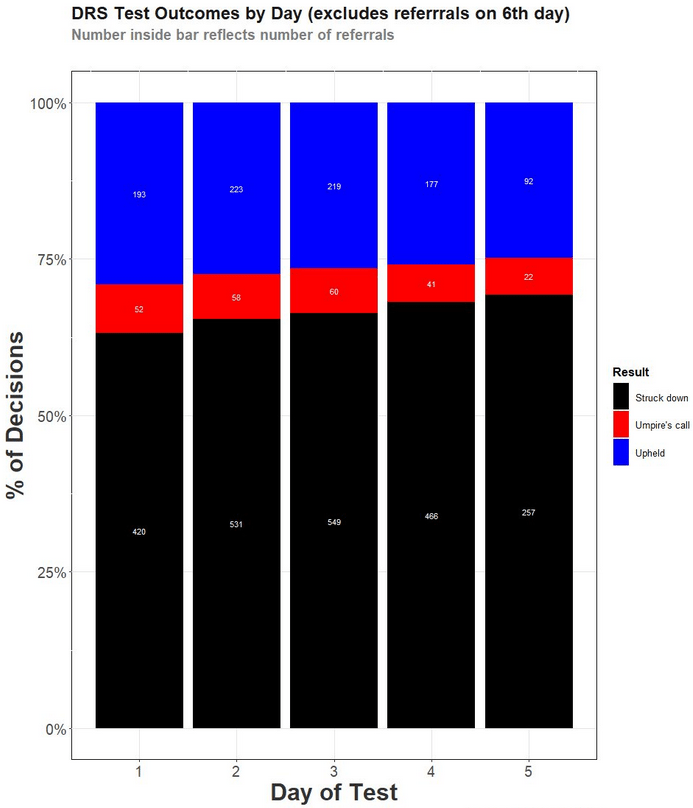
Trend 1 – Quality of reviews drops by day
Tony Corke (@matterofstats) got in before me with this trend – here’s the chart he produced
Trend 2 – Resetting reviews after 80 overs (2013-17 rules) reduced review effectiveness

The long term trend is fairly consistent – flitting around the 27% mark. Except for 2014 and 2015. I think I can explain that dip.
In 2013 a rule was brought in whereby reviews reset after 80 overs. This was to avoid punishing a team who lost reviews to marginal decisions. A better rule took over from autumn 2017 – “Umpire’s Call” decisions would not cost a review.
The impact of the resetting reviews was felt in overs 60-80: teams were in a position of “use it or lose it”, so did the logical thing and reviewed liberally. Thus, from 2013-16 the success rate in overs 60-80 was only 20%, having been 28% for those overs before 2013. Naturally, once the new rules took over from 2017, the success rate for overs 60-80 returned to 28%.
Trend 3 – DRS success rates differ by ground
The harder batting conditions are, the better the relative performance of fielding reviews versus batting reviews. Any scatter plot for this looks ugly, so you’ll just have to take my word for it that this is a statistically significant correlation. In lieu of that, here’s a chart of batting and bowling DRS success rates by ground.
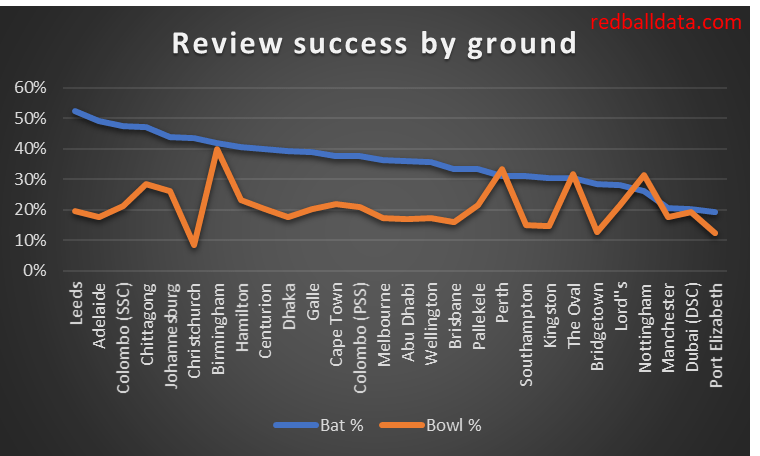
Now, I’m not sure which way the causation runs. One possibility is that at high scoring grounds the umpires get lulled into thinking batsmen aren’t going to get out, so they don’t believe their eyes when a batsman is out.
The key point I’d like you to take from this is just how consistent umpires are.