Writing last week about the careers of batsmen and the predictive power of their early performances, I glossed over something important. Batsmen don’t get magically better as they play more Tests.* Which supports my hypothesis that there is no benefit in giving a batsman experience at Test level. A batsman has a level of ability, which is revealed in Test Cricket as they play more games. It’s thus easy to model a batsman’s expected scores.**
What about bowlers?
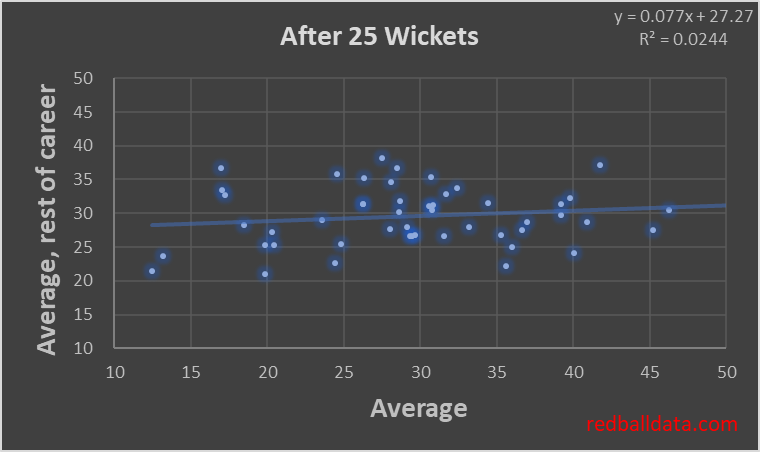
Noisy, as expected. This is (on average) after only seven Tests. Let’s skip forward to when they have 100 wickets:
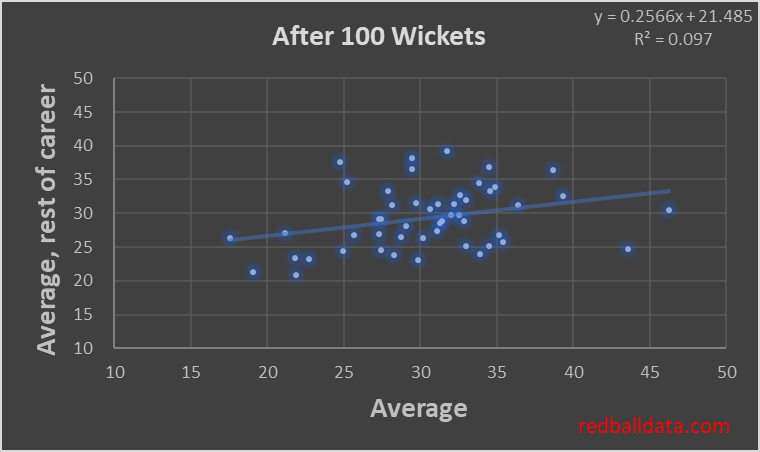
With 100 wickets players are well into their careers – yet there’s still no consistent pattern. I’m going to split these 50 players into two groups now: the main sequence, who behave nicely and whose past performance is a good guide to future success, and the others.
Here’s the 32 well behaved players:
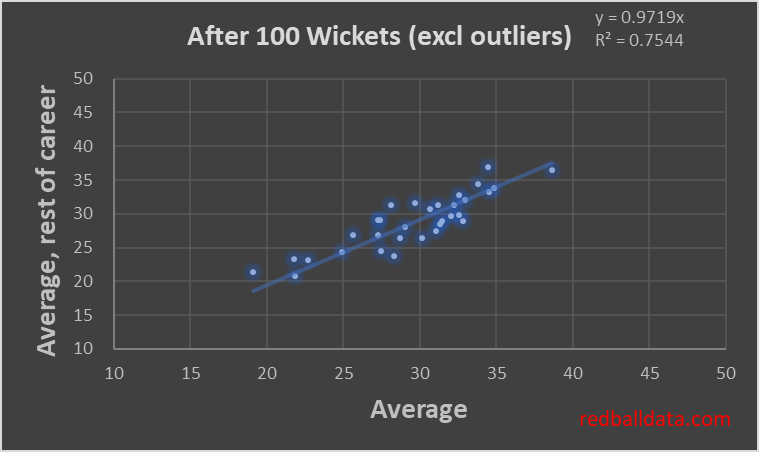
For two thirds of the players, once they have 100 wickets their future is neatly mapped out, and you can approximate that they’ll play at that level until they get dropped. What about the others?

Let’s reveal who these miscreants are. Amazing how career averages can gloss over being rubbish to start with (Flintoff) or how the mighty fell (Harmison).

Test career average is no good to measure these players. And they make up one third of the bowlers I’ve looked at. Crumbs, my models have been wrong all this time to use Test career average to measure current skill levels.
What causes this? Many possibilities: injury; being a late bloomer; switching from batting all rounder to bowling all rounder; getting “found out” as opponents learn your varieties and batsmen adapt.
How can we identify these players in advance? How do you know for sure who is now better or worse than their career average? With a spreadsheet, you won’t know. That’s a problem for me, because that’s all I’ve got. If you can read technique and separate the irrelevant detail from the significant change, then maybe. Perhaps there should be a “days since last ran” metric, like in horse racing, and anyone returning from a long layoff should be treated as a different player.
If we can’t identify the outliers, how can we rank every player accurately with one methodology? The good news – unlike batsmen, bowlers yield more data per match because they take lots of wickets per game. Whereas for a batsman we would use Difficulty-Adjusted-Career-Average, for a bowler we can use Difficulty-Adjusted-Last-Four-Year-Average, or similar.
Here’s the predictive power of more recent data. It may not look much better to the eye, but mathematically this is a better fit:
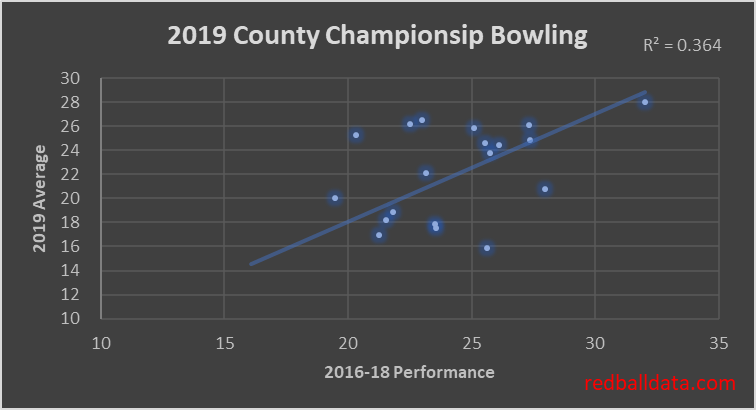
What have we learned? We should predict bowling performances based on what they have achieved recently – because for about a third of players their career average has limited predictive power. That means my model should pick up last four year performances, if too little data it should instead use career records.
* The line of best fit when plotting past vs future averages is a straight line that almost passes through zero.
**You also need to adjust for the age curve – batsmen get better as they get older, then drop off in their mid thirties. Also there will be the odd outlier (Ramprakash and Hick, for example, never made it at Test level), though examples of players with abnormal records after 50 Tests are likely to be rare.