T20 batting: running out of steam

When should you consolidate? I’ve devised a general rule to calculate when the batting team should slow down and conserve wickets.

Let’s recap the current state of T20 International batting. Teams usually end their innings with wickets in hand. Since 2016 the average first innings score is 166-6*. Teams rarely get bowled out, having enough batting depth to attack throughout, even if a wicket falls early on.

Looking at this another way, on average it takes more than 120 balls to bowl a team out. The openers can go out and play naturally, expecting the top seven to do the business. The number eight batsman averages only three balls per game. I think of limited overs batting in terms of “Expected Balls”: how long would you expect it to take to bowl this team out if they were batting normally? For example, England bat deep, expecting to last 172 balls before being bowled out – this gives them licence to attack in a game that’s only 120 balls long.

~~~

The more you get in the first innings, the higher your chance of victory. But get greedy, take too many risks, and you may fall short of a middling score that might have been enough. Any approach to batting has a range of possible outcomes. The goal is to pick the approach that maximises expected win %. How do you do that?

Here’s one example – consider a binary choice where number four in the first innings can either bat normally or anchor (Strike Rate down 10%, Average 20% higher). According to my model, for this current England T20 team, pre innings or at 0-1 anchoring is not optimal. 0-2 it’s marginal. It’s only worthwhile if you’ve slumped to 0-3. Which, coincidentally, is the point at which England’s expected balls drops below 120 (ie. they run the risk of the median innings not lasting 20 overs). This makes intuitive sense: tailor your batting aggression so you almost (but not quite) get bowled out.

Note this assumes England are playing against an equally talented team – hence win % pre game is 50%

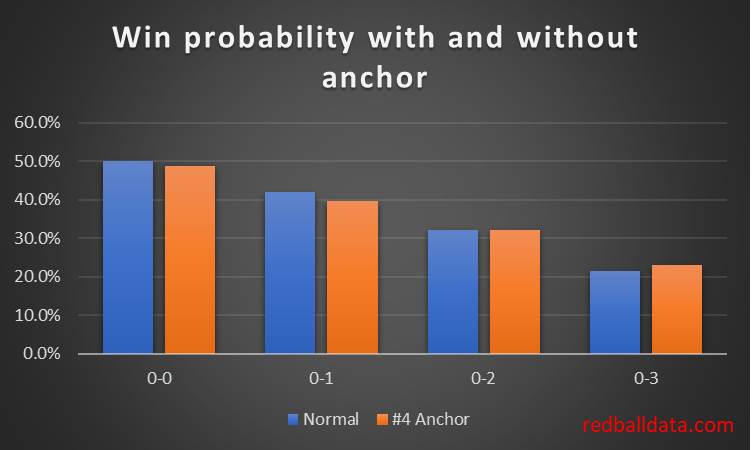
The general rule: bat normally unless Expected Balls < Balls Remaining.

A recent example – England were 34-3 (5.3) – which looks precarious, but the Bairstow-Stokes-Morgan middle order meant it was more-likely-than-not that England would bat all 20 overs, and have a reasonable chance of chasing their 180 target. England won the game in the 20th over. Maybe that “lose three wickets in the powerplay, lose the game” maxim is outdated as T20 averages improve. For England, Expected Balls exceeded Balls Remaining, even having lost three wickets in the powerplay.

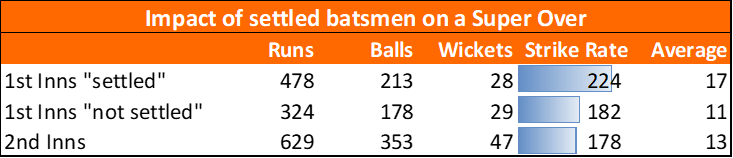
But this is too simplistic. Not everyone can strike at 150: you can’t expect fireworks from every tail. Here’s the strike rates of the top 10 T20I teams over the last five years. Numbers 9-11 just aren’t as good. I think of teams “Running out of steam” when all the quick scorers are out.**

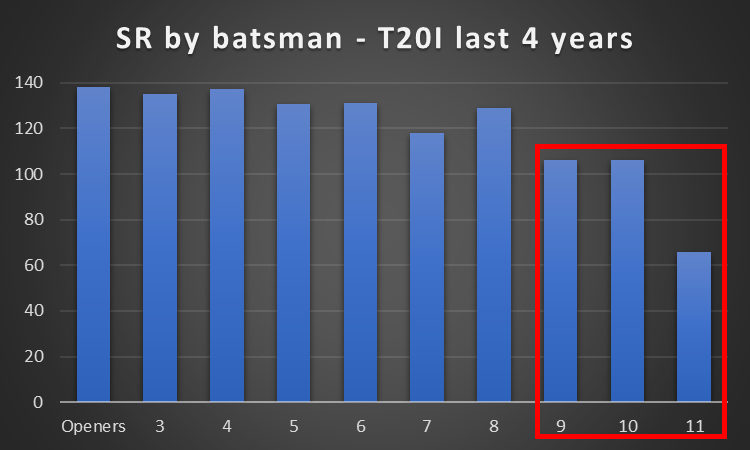
“Running Out Of Steam” depends of the composition of one’s batting order. England currently have Jofra Archer at number nine. Deep. West Indies aren’t so lucky – Keemo Paul bats at eight with a domestic career SR of 107 – so they Run Out Of Steam at six down.

My hunch is that cricketers know what their tail is like, and how likely it is that tail will be exposed, and bat accordingly. Take another recent example – WI T20 #1 – at 59-5 (5.1) West Indies were vulnerable. One more wicket and they were done for. So Pollard and Allen consolidated, taking 37 from the next five overs. A rain interruption meant the innings was reduced to 16 overs. With just six overs left – it was time to attack, lifting the score to 180 by the end of the innings. Subsequent discussion focussed on the impressive assault, missing the responsible consolidation period that made it possible.

~~~

Here’s the “Balls to Run Out Of Steam”*** for the Top 8 T20I sides, based on their most recent XI

As at December 2020

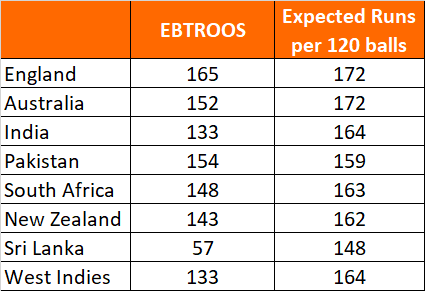
This tells us that England, Australia and Pakistan have the capacity to score more quickly than each player’s career record (ie. if they bat naturally, they are wasting resources by being too conservative). If wickets fall, that should be reassessed****.

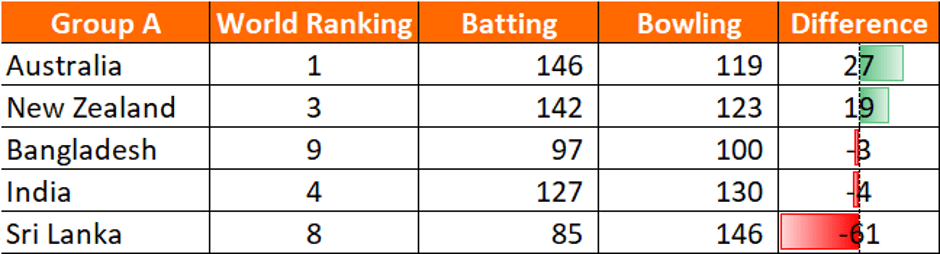
Note Sri Lanka put out a particularly weak XI in their last game. Numbers four and below would expect to strike at below 130 – way off the pace. Hence they run out of hitters unusually quickly.

Teams should tailor their aggression, aiming to not quite run out of steam. To do this, throughout the innings the batting team should compare EBTROOS to balls remaining, adjusting the EBTROOS as wickets fall.

Just imagine those clipboards showing live updates of Expected Balls To Run Out Of Steam, and Optimum Strike Rate. (Screenshot from Sky Sports)

Footnotes

*Top 10 teams against each other. Sorry Luxembourg.

**I wish I was good at writing. Spent ages trying to come up with a better name for it than “running out of steam”. Ideas welcome.

***BTROOS = Balls To Run Out Of Steam. This is clunky stuff.

**** There’s an added complexity which I’ll keep for the footnotes: median innings length is not the same as balls per wicket. The difference is only 4% at the start of the innings, but gets bigger as fewer wickets are left. Here’s the same table, but with Median Balls To Run Out Of Steam*****. MBTROOS = Median Balls To Run Out Of Steam. Perhaps MBTROOS could rhyme with albatross. Anyway, here’s the MBTROOS for the latest England T20 lineup:

MBTROOS for England. Note 3 down after the powerplay would mean MBTROOS 86, which are two balls more than the 84 remaining. So keep attacking!

Rating the Blast teams … Lancashire’s batting is better than it looks

I rated the county 20-20 batting in one hour of analysis. Reckon I need to understand 20-20 eventually.

My starting position: scoring quickly is good but getting out is bad. Thus the best teams will score quickly, with high “balls per dismissal”.

Here’s how that looks for this year’s teams (rated using the most commonly used XI this year):

Quarter final qualifiers in green, eliminated teams in red. Only the top eight batsmen’s SR has been included as the tail rarely bats, but the whole team has been included in the BPD calculation.

Averages matter

Surrey and Gloucestershire score just as quickly as Yorkshire and Kent, but with higher balls per wicket they are less likely to fail – so are more consistent and better batting units.

I had heard that averages don’t matter in 20-20: I think they do.

A team has to be confident of lasting 120 balls. I don’t know how many balls you need to expect the unit to survive before getting bowled out in 120 becomes unlikely – maybe 180? Only three teams on the right of this chart are at that level. Once all teams are there then wickets cease to be a limiting factor, and it’s all about strike rate.

Lancashire – skewed by strong bowling

Bottom right should contain bad teams: trundling to 140 and losing.

Yet Lancashire won five games this summer with a team where no-one has a four year SR over 135. They even scored 190 (SR 158) against Durham. What’s going on?

The key is that they are a strong bowling team that often have easy chases. They thus play within themselves to secure the win. This makes their players look like plodders. Yet batting first they score 177 on average over the last two years. While chasing that drops to 129.*

Lancashire’s true position on the chart would be somewhere up and to the left. Repeating this chart with first innings data would help.

Here’s my attempt at a Boston Consulting Group** view of T20 team batting:

Stars: good teams. Dogs: bad teams. Question marks: Could be bad teams, could be players looking slow from chasing small totals. Roller-coasters: Might score 200 one game, 105 all out the next.

I’ve only looked at the batting, but I feel like this view might have some predictive power. 2/6 Dogs qualified, 1/5 Roller-coasters, 2/3 Question Marks, 3/4 Stars. The three Stars were the three group winners.

*Data up to 19th Sept 2020.

** Boston Consulting Group suggested in 1970 that companies could consider any product as being one of four types in a market (Star, Dog, Question Mark, Cash Cow). I’ve ripped off their idea to try to look like I know about business as well as cricket.

IPLsplaining

Himanish Ganjoo (@hganjoo153 on Twitter) kindly shared some IPL data with me. Now, I’ve not seen the IPL for a long time, and the last T20 I went to was almost a year ago*. But I can play with data. Here I’ll explore batting in the last five overs.

Batsmen have scored 59,958 runs in overs 16-20 in the IPL, at a strike rate of 154. What makes a successful batsman? To start with, I’ll check the correlations between strike rate and Dots/Singles/Boundaries.

There’s a weak inverse correlation between dots and strike rate.
The inverse correlation between % of balls hit for a single vs strike rate is more compelling
Well now. That’s rather a good fit.

Strike rate in the last five overs is all about boundary hitting. The slow players hit one ball per over to the boundary, where the four top batsmen hit two.

Slowcoaches

Let’s look at the batsmen that don’t sparkle at the end of the innings:

Not a boundary hitter in sight. None of them have hit 20% of deliveries to the boundary, so all of them underperform.

A shallow read of this says these players are either batting too high (shouldn’t be batting at all) or too low (being exposed trying to keep up at this stage of the innings). Since I know little about T20 I won’t try and go further than that!

Really surprised to see Shakib Al Hasan on the list. There’s a wider point – Al Hasan’s strike rate in ODIs is a healthy 83, yet in T20Is it’s an anaemic 124. I may follow up and see how common that is.

Another way

What about six hitting? I know it’s supposed to matter, but it’s not essential. Here’s some fine batsmen doing it differently:

On average 7.2% of balls in the last five overs in the IPL are hit for six. You can be a successful batsman at the death even if you can’t hit sixes as well as that. These players manage it. All keep their dot ball percentage under 30, they hit way more fours than average, and take slightly more singles.

It’s good to see – there’s room for those that keep it on the deck, even at the end of a T20 innings. Selectors take note.

Farming the strike

If one of the rare 200+ SR players bats with a 130SR player, they would expect to score 0.7 runs per ball more than their partner. There’s an argument for refusing singles, apart from on the last ball of the over.

Similarly, the weakest batsmen should be looking to turn the strike back to an elite batsman. If batting normally is worth 1.3 runs per ball, then the cost of taking a single is only 0.3 runs that ball, and it should be made up for by having the better batsman facing.

The data doesn’t really bear that out (if it did, the trendline for strike rate vs singles wouldn’t be a straight line). Maybe T20 cricket hasn’t fully absorbed this lesson. Or maybe it has, but doesn’t show up as this analysis is based on the last 12 years.

Conclusion

That boundary % chart will stay with me. Boundaries are so valuable that the skill of turning a dot into a one, or finding the gap so one becomes two doesn’t really show up. But we’d be fools for thinking that sixes are the only currency. Fours are OK with me.

* At Cheltenham. Benny Howell took his only T20 five wicket haul. It rained a lot.

First Day Blues – when multiple debutants struggled with the bat

44 Test players picked up a pair on debut. This article covers when a raft of new faces are introduced, and things don’t go to plan.

While looking at some proper analysis (“has professionalism seen an increase in the depth of batting lineups?”), I noticed the torrid time Pakistan Women had at the hands of Denmark in the 1997 Women’s World Cup. That inspired me to trawl through the records and see what we can learn from history.

This could be interpreted as being somewhat cruel – that’s not my intention. Just a bit of trivia, and the pleasure of hearing some new stories from scorecards of the past.

5. Sri Lanka vs Pakistan, 1994 Test. Pakistan won by an innings and 52 runs. Debutants scored 19-6. Average 3.2 runs per wicket.

In their defence, two of the three hapless debutants were batting at 10 and 11 (see here). Also Pakistan had Younis, Akram and Mushtaq Ahmed.

4. New Zealand vs Australia, 1946 Test. Australia won by an innings and 103 runs. Debutants scored 35-12. Average 2.9 runs per wicket.

Hard to be too critical as countries rebuilt after World War Two. New Zealand were outclassed, making just 96 runs in the match. Len Butterfield and Gordon Rowe bagged two of the 44 pairs mentioned above. 32 year old Butterfield went wicketless in his only Test, and final First Class match.

There were two silver linings. It was the only Test for Ces Burke (2-30) thus securing a career average of 15. Also, New Zealand didn’t stay in the doldrums for long: going on an unbeaten run of six draws after this defeat.

3. Turkey vs Luxembourg, 2019 T20I. Luxembourg won by 8 wickets. Debutants scored 21-10. Average 2.1 runs per wicket.

The Romania Cup in 2019 is best known for bringing Pavel Florin into the limelight. It also yielded this blowout – 21 runs off the bat, 28 all out. One boundary in 69 balls of T20, the top scorer made seven.

During the tournament Turkey were rolled for the three lowest T20I scores ever recorded. On two of these occasions they were bowled out in the first ten overs.

Luxembourg’s chase is on Youtube. Turkey look really raw – at 21:10 Serkan Kizilkaya takes a wicket while fine leg was sprinting to third man, having not noticed the single off the previous ball.

Let’s try to “take the positives”: Peshawar Zalmi of the Pakistan Super League hosted two of the Turkish team during the 2019 PSL, as part of a programme to support Turkey Developing Sports Branches Federation. One success was the development of 19-year-old Mehmat Sert, whose 42 runs were 31% of Turkey’s tally in the Romania Cup.

2. Pakistan Women vs Denmark Women, 1997 ODI. Denmark Women won by 8 wickets. Debutants scored 3-6. Average 0.5 runs per wicket.

This is my favourite of the five tales. Denmark Women, in the ’97 World Cup, beating Pakistan. There’s no writeup I can find, so crumbs from the scorecard will do:

Pakistan were inserted. From 58-4 when Asma Farzand was run out, the other five debutants contributed 0-5 from 19 balls as Susanne Neilsen and Janni Jonsson ran amok. Somehow (if Cricinfo is to be believed), Shazia Hassan managed to be LBW without facing a ball.

There were 29 extras in Pakistan’s 65 all out – 45% of the runs were sundries. Let me know if you can find a higher ratio in international adult Cricket.

Despite it being a limited overs game, Pakistan’s quickest scorer went at 28 runs per hundred balls.

1. Mali Women vs Rwanda Women, 2019 T20. Rwanda Women won by 10 wickets. Debutants scored 1-10. Average 0.1 runs per wicket.

The card: 1 0 0 0 0 0 0 0 0 0* 0

Rwanda truly turned the screw. Six wicket maidens and two maidens. They knocked the target off in four balls – just think of the net run rate.

Take pity on Margueritte Vumiliya – Rwanda’s opening bowler had figures of 3-3-0-2 and got pipped to the player of the match award.

I mentioned Turkey being bowled out twice in under 10 overs. The only other international side to manage that was Mali Women. Twice.

***

Just because New Zealand and Sri Lanka went on to become strong teams, doesn’t mean that Turkey or Mali Women will. Denmark Women folded in 1999. What did we learn from this? Nothing. In my excitement to say something about Denmark Women’s win in 1997, I’ve created a listicle.

How to win a Super Over

I had a piece published in Vox Cricket’s first issue.

Suggest you read the full article there. In case you don’t fancy clicking, here are the key drivers to Super Over success…

  1. Score at least twelve runs if batting first
  1. Pick a set batsman if batting first
  1. Don’t let the number three play it safe if batting first
  1. Stay calm when chasing
  2. Pick a bowler to trouble their opening batsmen
  3. Put the best batsman on strike for the first ball
  4. Plan for a second super over

That’s seven factors without even considering lines, lengths, field placings or shot selection. Super Overs might look like a six ball thrashabout – but there are subtle forces at play.

Women’s T20 World Cup – Rating the teams

Now that every team (bar Pakistan) have played, I can use the batting and bowling records of each starting XI to paint a picture of what we can expect to happen in the group stages.

This is a quick and dirty piece of analysis – I’ve only used ODI and T20I data between the top nine teams. Scarcity of T20I data meant ODI was used as a proxy – scaling down the averages by 76% and increasing the strike rates by 147%. Time will tell how good this method is.

Somehow watching sport without understanding context and probabilities no longer satisfies me – I want to know what is happening, and to do that data is required. Hence this piece.

The below chart ranks batting strength on the x-axis (expected runs on an average pitch against an average attack). The y-axis is the same but for runs conceded. The ideal team would be in the bottom right of the chart.

The big three stand out: Australia, New Zealand and England. These are consistent with the ICC rankings.

Let’s look at the groups.

Group A is marginally stronger. Despite beating Australia, India aren’t all that hot at batting – remove Shafali Verma early and the rest of the order are unlikely to score at much over a run a ball. Both India’s wins have come after Verma set a platform. Bangladesh have what is on paper an economical bowling attack, though having slipped up against India, they’ll have a tall order containing Australia and New Zealand.

Current expectation is that two of Australia, New Zealand and India should go through. Australia vs New Zealand on 2nd March is the final game of the group, and is likely to decide both who goes through and the position they go through in.

Group B is more clear cut. England lost to South Africa, which was seen as something of an upset, though player data indicates the sides are fairly well matched.

Aside from Chloe Tryon, South Africa aren’t an explosive batting unit. What they have in their favour is that they are dependable. Strong averages down the order mean they will rarely get rolled. That should be good enough to get them three wins out of four and into the semi finals. Note that the women’s version of T20 cricket is subtly different – with lower averages, teams are at much greater risk of being bowled out: so the averages of the lower middle order matter.

England are a similar proposition to South Africa – no stars with the bat, yet a top eight who should all yield more than a run a ball. Hard to see anyone other than England and South Africa progressing.

Being frank, West Indies and Pakistan are holed below the water line once three wickets are down. Look out for them wasting good starts.

Wrapping up, it’s hard to look past the big three teams. Still, South Africa at odds of 14-1 look tempting since I’d expect them to be the fourth semi-finalist. (Odds as at 25th Feb).