
I rated the county 20-20 batting in one hour of analysis. Reckon I need to understand 20-20 eventually.
My starting position: scoring quickly is good but getting out is bad. Thus the best teams will score quickly, with high “balls per dismissal”.
Here’s how that looks for this year’s teams (rated using the most commonly used XI this year):
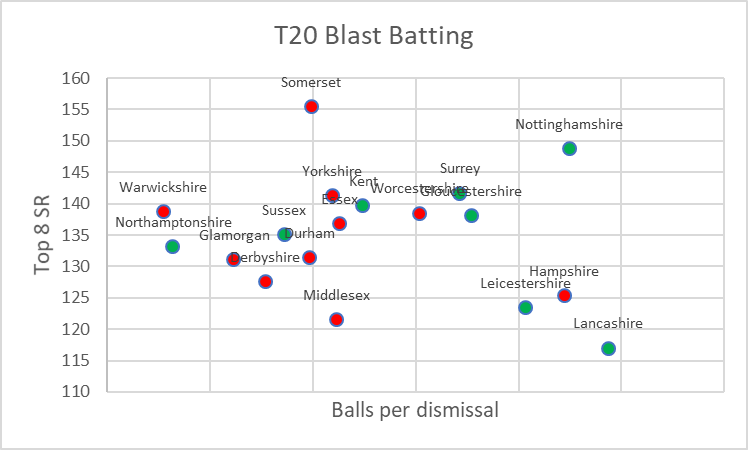
Averages matter
Surrey and Gloucestershire score just as quickly as Yorkshire and Kent, but with higher balls per wicket they are less likely to fail – so are more consistent and better batting units.
I had heard that averages don’t matter in 20-20: I think they do.
A team has to be confident of lasting 120 balls. I don’t know how many balls you need to expect the unit to survive before getting bowled out in 120 becomes unlikely – maybe 180? Only three teams on the right of this chart are at that level. Once all teams are there then wickets cease to be a limiting factor, and it’s all about strike rate.
Lancashire – skewed by strong bowling
Bottom right should contain bad teams: trundling to 140 and losing.
Yet Lancashire won five games this summer with a team where no-one has a four year SR over 135. They even scored 190 (SR 158) against Durham. What’s going on?
The key is that they are a strong bowling team that often have easy chases. They thus play within themselves to secure the win. This makes their players look like plodders. Yet batting first they score 177 on average over the last two years. While chasing that drops to 129.*
Lancashire’s true position on the chart would be somewhere up and to the left. Repeating this chart with first innings data would help.
Here’s my attempt at a Boston Consulting Group** view of T20 team batting:
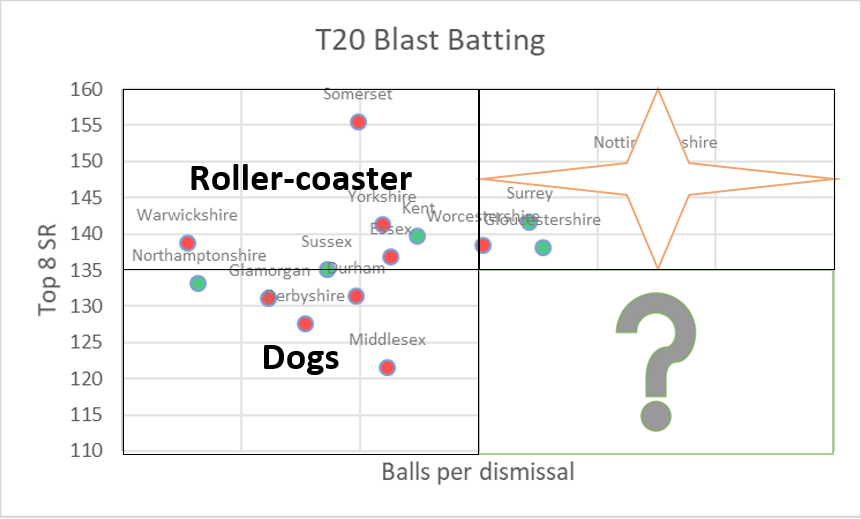
I’ve only looked at the batting, but I feel like this view might have some predictive power. 2/6 Dogs qualified, 1/5 Roller-coasters, 2/3 Question Marks, 3/4 Stars. The three Stars were the three group winners.
*Data up to 19th Sept 2020.
** Boston Consulting Group suggested in 1970 that companies could consider any product as being one of four types in a market (Star, Dog, Question Mark, Cash Cow). I’ve ripped off their idea to try to look like I know about business as well as cricket.
