IPLsplaining

Himanish Ganjoo (@hganjoo153 on Twitter) kindly shared some IPL data with me. Now, I’ve not seen the IPL for a long time, and the last T20 I went to was almost a year ago*. But I can play with data. Here I’ll explore batting in the last five overs.

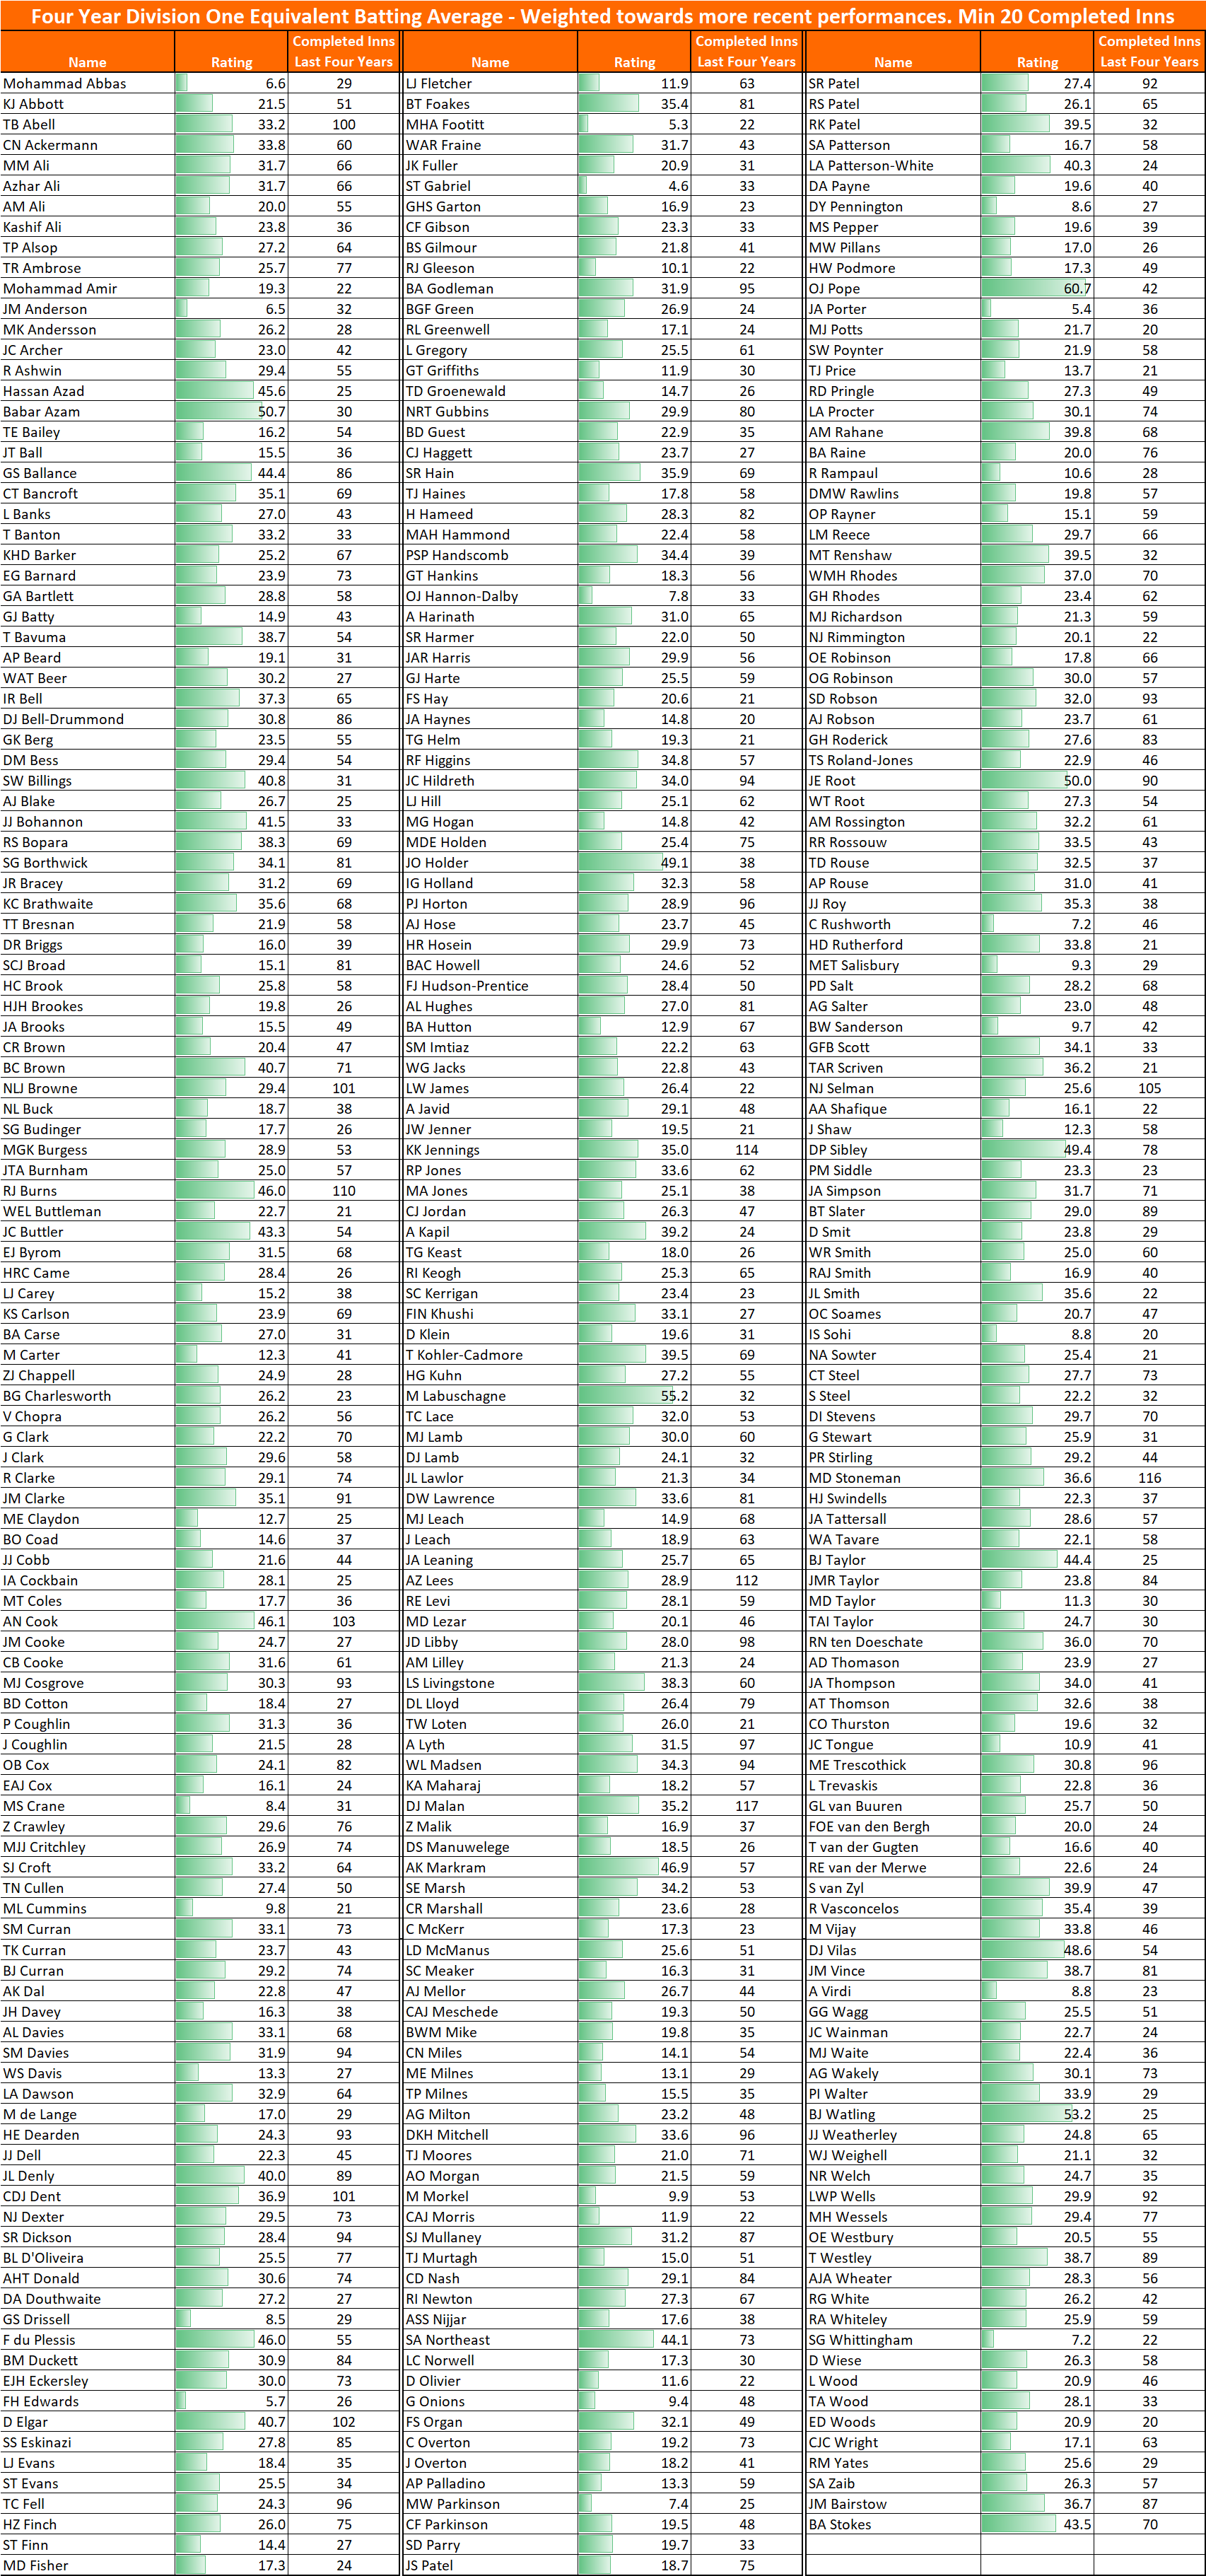
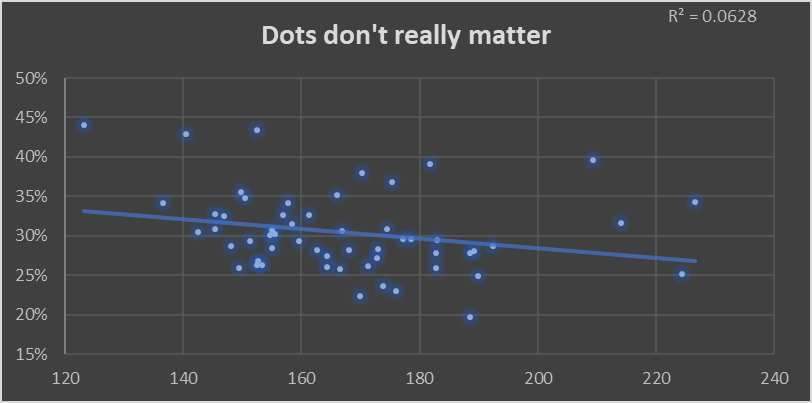
Batsmen have scored 59,958 runs in overs 16-20 in the IPL, at a strike rate of 154. What makes a successful batsman? To start with, I’ll check the correlations between strike rate and Dots/Singles/Boundaries.

There’s a weak inverse correlation between dots and strike rate.
The inverse correlation between % of balls hit for a single vs strike rate is more compelling
Well now. That’s rather a good fit.

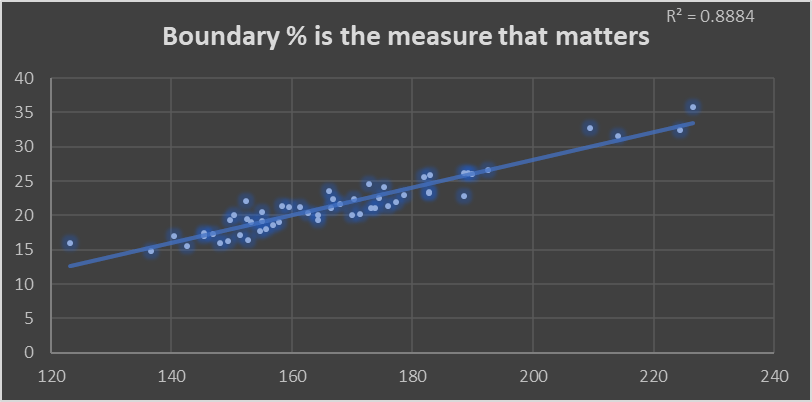
Strike rate in the last five overs is all about boundary hitting. The slow players hit one ball per over to the boundary, where the four top batsmen hit two.

Slowcoaches

Let’s look at the batsmen that don’t sparkle at the end of the innings:

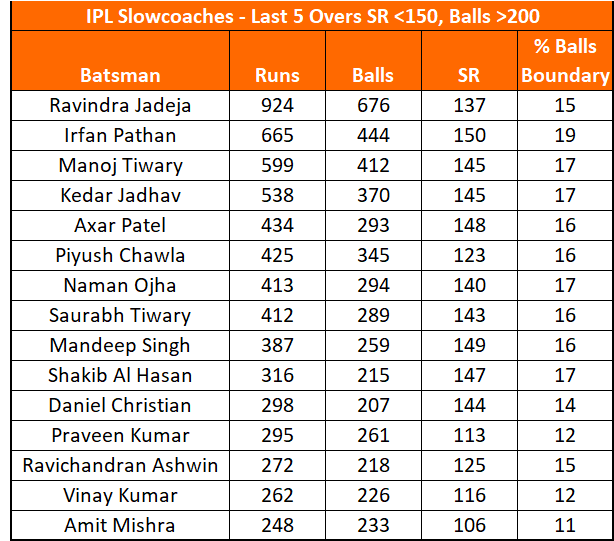
Not a boundary hitter in sight. None of them have hit 20% of deliveries to the boundary, so all of them underperform.

A shallow read of this says these players are either batting too high (shouldn’t be batting at all) or too low (being exposed trying to keep up at this stage of the innings). Since I know little about T20 I won’t try and go further than that!

Really surprised to see Shakib Al Hasan on the list. There’s a wider point – Al Hasan’s strike rate in ODIs is a healthy 83, yet in T20Is it’s an anaemic 124. I may follow up and see how common that is.

Another way

What about six hitting? I know it’s supposed to matter, but it’s not essential. Here’s some fine batsmen doing it differently:

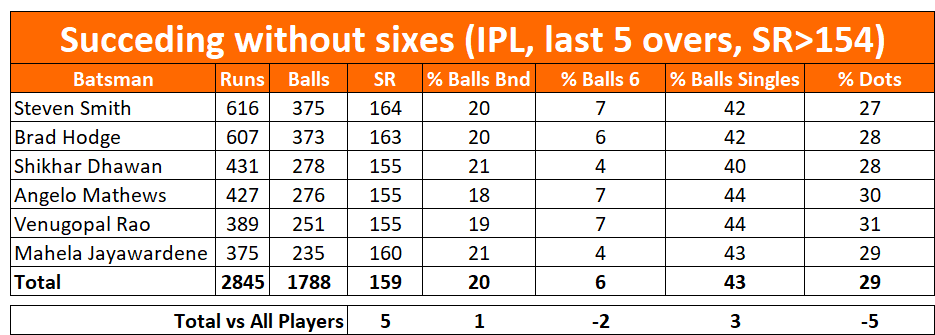
On average 7.2% of balls in the last five overs in the IPL are hit for six. You can be a successful batsman at the death even if you can’t hit sixes as well as that. These players manage it. All keep their dot ball percentage under 30, they hit way more fours than average, and take slightly more singles.

It’s good to see – there’s room for those that keep it on the deck, even at the end of a T20 innings. Selectors take note.

Farming the strike

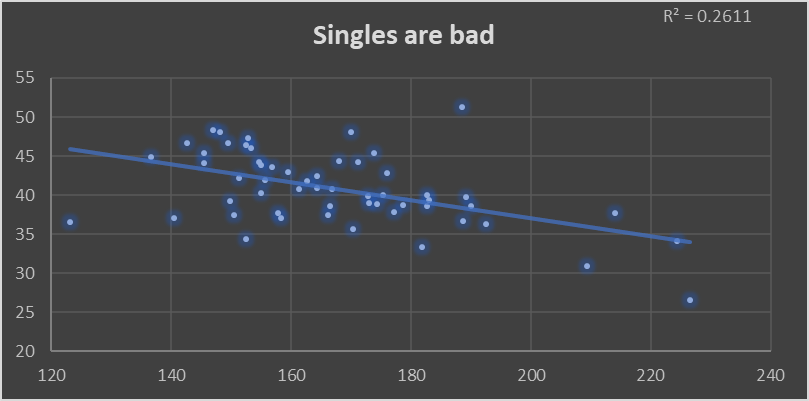
If one of the rare 200+ SR players bats with a 130SR player, they would expect to score 0.7 runs per ball more than their partner. There’s an argument for refusing singles, apart from on the last ball of the over.

Similarly, the weakest batsmen should be looking to turn the strike back to an elite batsman. If batting normally is worth 1.3 runs per ball, then the cost of taking a single is only 0.3 runs that ball, and it should be made up for by having the better batsman facing.

The data doesn’t really bear that out (if it did, the trendline for strike rate vs singles wouldn’t be a straight line). Maybe T20 cricket hasn’t fully absorbed this lesson. Or maybe it has, but doesn’t show up as this analysis is based on the last 12 years.

Conclusion

That boundary % chart will stay with me. Boundaries are so valuable that the skill of turning a dot into a one, or finding the gap so one becomes two doesn’t really show up. But we’d be fools for thinking that sixes are the only currency. Fours are OK with me.

* At Cheltenham. Benny Howell took his only T20 five wicket haul. It rained a lot.

Lower order CC Division 2 runs – are they predictive of Test performance?

Jofra Archer is struggling with the bat in Test cricket, averaging eight and lengthening the tail. Yet he has a First Class average of 26. Is he getting an easy ride batting down the order for Sussex, then being found out at the highest level? Let’s find out.

Recap – Linking Division 2 and Test Batting

Previous workings showed that a played would expect to average 72% as much in Tests as they do in Division 2 (D2). There isn’t that much data though: most Test players are drawn from the top division. Just four players have over 20 completed innings at both levels over the last four years:

Not a bad fit – D2 averages do have reasonable predictive power of Test performance for batsmen (please take note Mo Bobat). You just need to play a decent number of games in both formats.

But what about tail enders in Tests?

Most of the overseas players in D2 are batsmen. There aren’t many bowlers in D2 to have also played Test cricket lately. Here’s the data for the five lower order batsmen to have eight or more completed innings in Tests & D2:

Remember none of these players has 20 completed innings in both formats, so expect volatility. Archer and Mohammad Abbas are the outliers: Archer averaged nearly four times as much in D2, while Abbas has a slightly higher Test average.

Across the five players, their Test average is 63% of their D2 batting average (for all players this figure is 72%).

Tail enders in D2 vs D1

Data is lacking on tail enders in D2 and Tests. Let’s answer a different question. If we are happy with the standard of D1, then all we need to do is demonstrate similar averages for the lower order in D2 and D1, and we can conclude that Jofra Archer is good at batting.

The above chart is for all batsmen that have >15 completed innings in D1 and D2. If anything the trend is for higher averages in D1. Can’t explain that, but at least that gives some comfort that the tail isn’t getting an easier ride in the lower division.

Conclusion

Jofra Archer would be a very unusual player if he continues to average under ten in Tests. I would expect him to average 17 in Tests based on all available red-ball innings. It just happens that the County Championship has seen the best of his batting, and Test cricket the worst.

Batting: All County Cricketers Rated

This page contains expected County Championship Division One batting averages for all County Cricketers to have i) played during 2019; and ii) batted in at least 20 completed innings since 2016.

Performances in the Second Eleven Championship, County Championship and Test Cricket are included, though each performance is weighted according to the level being played at (so averaging 30 in Test Cricket is much better than averaging 40 in the Second Eleven Championship).

To give a better indication of current ability, and to partly adjust for age, ratings are weighted more heavily towards recent performances.

Ratings are shown if each player were playing in Division One – this ensures bowlers are compared on an apples-to-apples basis.

This version includes matches up to 29th September 2019. For an update, see the 2021 County Championship preview, which contains much more information about each player.

Top batsmen

Fig 1 – Top 50 Batsman in 2019 County Cricket. Min 40 completed innings since 2016.

Full list

Fig 2 – All Batsmen in 2019 County Cricket. Min 20 completed innings since 2016.

Key findings

Zak Crawley is an odd Test selection

  • Expected Division 1 average under 30
  • Only averaged 34 in 2019, after averaging 32 in Division 2 in 2018.
  • Even separately adjusting for age (he’s only 21), it’s hard to argue he’s currently better than Dent & Rhodes.

Ollie Pope is practically too good to be true

  • Expect his average to come down – he can’t possibly have an expected average exceeding 60.
  • Only 42 completed innings – barely a sufficient sample size to be included in the top 50 players.
  • Still, he’s easily worth a Test place.

Very few English batsmen are capable of consistently averaging over 40 in Division 1

  • Cook, Ballance, Northeast and Brown are the four England qualified batsmen who would be more likely than not to average over 40.

There’s more decent English openers than you may have been told elsewhere

Keaton Jennings, Mark Stoneman, Chris Dent and Will Rhodes could cover Burns and Sibley. And, if he could be coaxed out of Chelmesford, Cook.

England selectors might well be relieved that Cook has retired – imagine having to choose two out of Cook, Sibley and Burns to open the batting.

What do you think?

No doubt there’s plenty of themes and trends from the data that I’ve not mentioned – please do drop me a line through the contact page or @edmundbayliss on Twitter and let me know what you think.