Cricviz put out a tweet recently showing how James Anderson’s Expected Average has steadily improved over his career. That consistency is in contrast to volatility in his actual average. In this piece I’ll explore why Expected Average may be more reliable than actual averages.
Background
It’s worth recapping what Expected Average is. Cricviz use ball tracking to build a database of many deliveries, so know for a given ball (perhaps an 82mph full away-swinger) how many runs would on average be scored, and the likelihood of taking a wicket. Expected Runs divided by Expected Wickets is Expected Average*.
Why is Expected Average compelling? It captures that which is under the bowler’s control. The trajectory of a ball, its seam position, pace and spin are controllables. Everything else is outside the bowler’s sphere of influence (who are you bowling to? Do they edge it to first slip, edge it for four, or miss it completely?) Expected Average always rewards good bowling, unlike the fickle real world.
Expected Average beats actual average
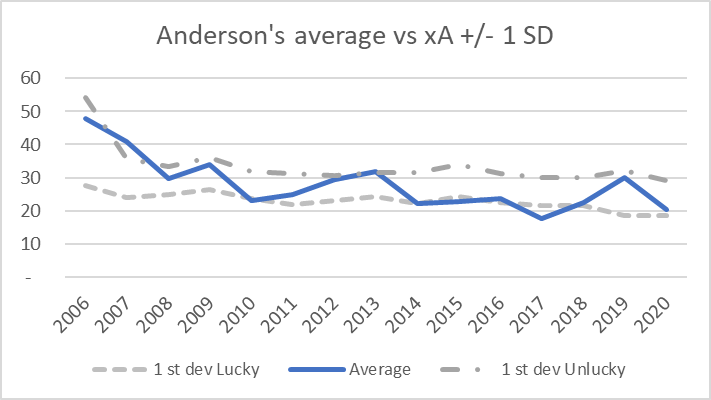
Returning to Anderson: looking at his bowling average year-by-year you’d say he blows hot and cold. Seven years averaging under 24, but five years averaging over 30. Contrast that with his (very stable) Expected Average. Using xA the volatility disappears – it tells a different story: Anderson has been a consistent bowler, improving steadily to become the player he is today. I find that easier to believe.
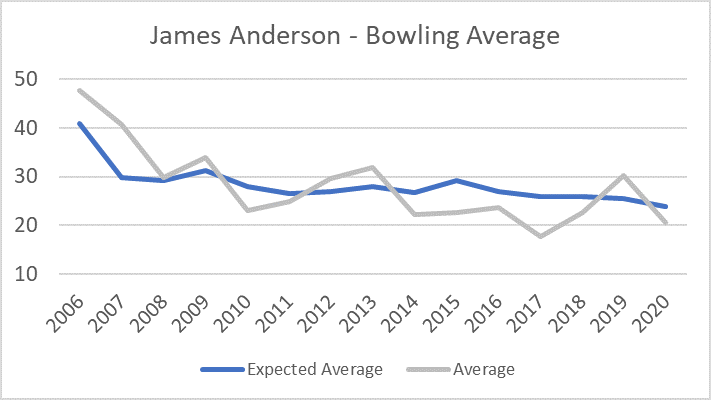
The two metrics (actual average and Expected Average) can be reconciled by assuming that actual average is a function of Expected Average and luck. Using my formula for error bars [1 standard deviation = xA * xW(-0.5)], we get the following chart, which shows that Anderson’s ups and downs might be quite normal (ie. two thirds of the time the blue line is between the grey lines).
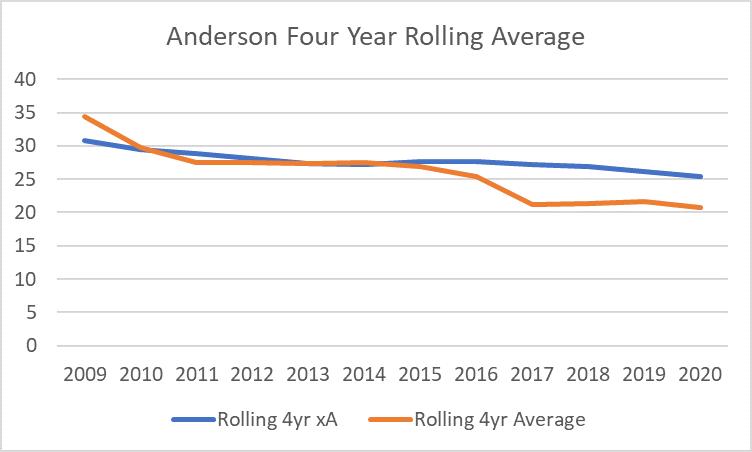
How can we get past the impact of luck? Look back at the formula. Uncertainty scales with the inverse square root of wickets. More matches, more wickets, less of a look in for Lady Luck. Let’s consider a rolling four year horizon, where luck is corralled into a +/-2 impact on average (below). Average and Expected Average nicely aligned. Expected Average bypasses the need for luck to iron itself out over time: it’s a better metric. Everything wrapped up in a neat little package.
Limitations of Expected Average
So far, so predictable. Now the fun part. Here’s a hypothesis for you: Expected Average is incomplete as it misses the impact of “setting a batsman up”.
A googly pitching on the fourth stump is a fine ball. But isn’t it better after a sharply turning leg break that beat the outside edge? Or an inswinger after four well targeted outswingers?
Did you notice how Anderson has outperformed his Expected Average on a rolling four year basis recently? What if that’s not noise, but rather a master craftsmen conditioning a batsman to play the last ball rather than the next one? And knowing from experience just what to bowl? That would manifest itself as Anderson taking wickets with balls that are better than they appear in isolation on a highlights package.
There could be a number of other causes (attacking fields / batsmen playing him on reputation), and it’s a bit rich me trying to throw shade on Cricviz’s metrics by mining the jeepers out of the data in one tweet. Still, food for thought. I’d give you something concrete, but that will take much more hoovering up the trail of breadcrumbs Cricviz leave through their twitter account and blogs.
The future of Expected Average
Cricviz will take their time building trust in Expected Averages. They have a tough concept to sell if they want xW xA xR to enter the lexicon: most of what we see (and debate) is noise. Signal takes years. People won’t want to hear that because it’s boring, counter-intuitive and at odds with standard narratives.
Expect them to make the case for luck’s impact slowly. They’ve done the right thing having strong communicators on board. Here’s an example, suggesting that Anderson’s ups and downs this summer were just luck. That’s something we can believe: a run of fortune ruining a week. The harder message to land will be impact of luck on a series or even a year. Discretion being the better part of valour, Cricviz didn’t actually state Anderson’s xA in the piece, just that it was better than his actual average. They waited until the numbers aligned before quoting xA.
The data revolution will be televised. It just might take a while to convince everyone it happened.
*I can’t be sure this is their exact definition, but it’s close enough.