Last time I looked at how long it takes for averages to mean something. Thought I’d try the same analysis for 20-20 Strike Rates. How long before a player’s 20-20 SR is a fair representation of that player?
Play for long enough and a batsman’s Strike Rate reflects their ability. However, in the early stages their career Strike Rate will be volatile as the sample is small. One significant factor is the impact of average on Strike Rate: most innings accelerate as they go on, so one big score early on will give a player a temporarily favourable career SR.
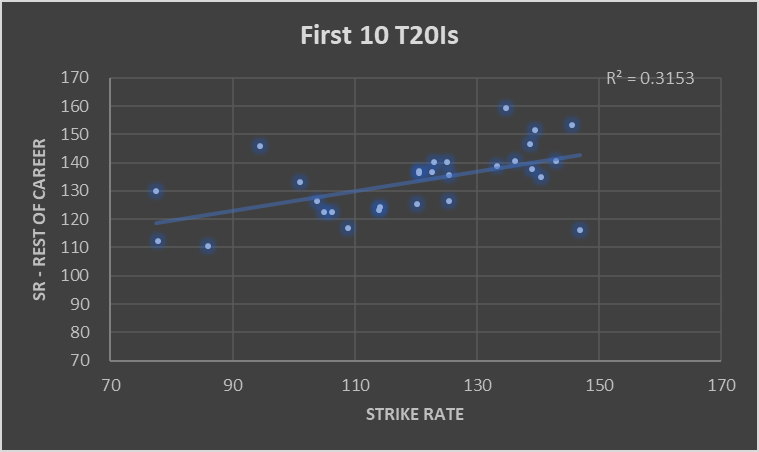
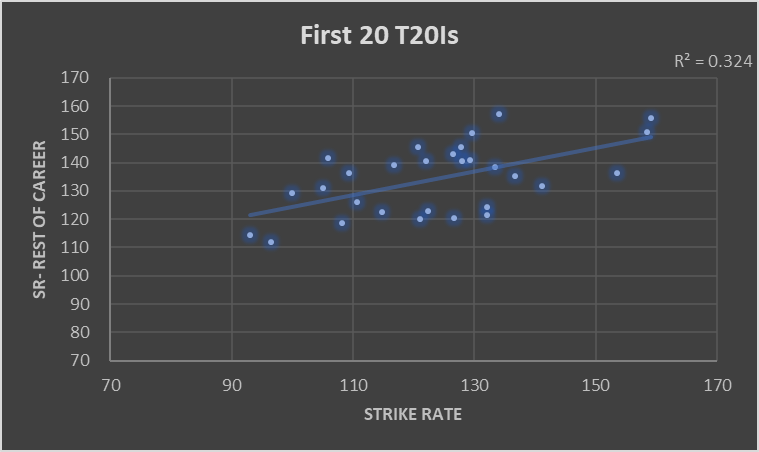
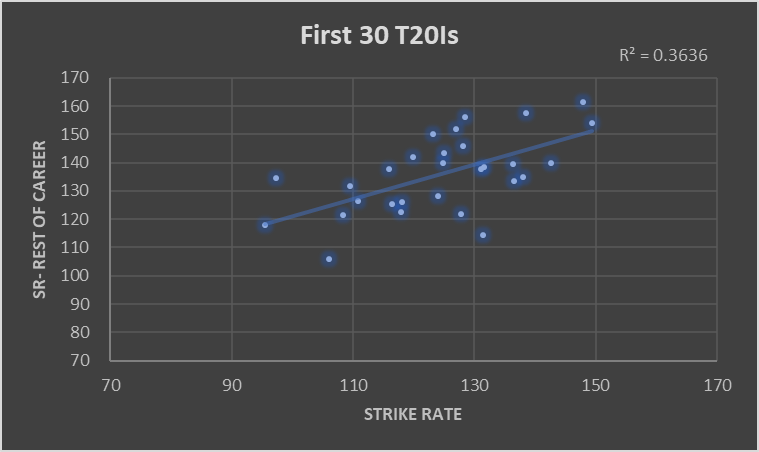
The below chart shows T20I Strike Rates for all players with 60+ Innings since 2009, split by their first ten, twenty or thirty innings (x axis) and then subsequent innings (y axis). Note that the acceleration in T20 scoring in recent years means most players scored faster in their later innings.
Consider the players who had a SR of 130 in their first 30 innings: one (Dilshan) stuttered and struck at 114 afterwards. Another (Nabi) scored at 156 per hundred balls in subsequent T20Is. If you have a player that has scored at eight an over in their first 30 innings, you may only know that they’ll score at between seven and nine per over from then on. Not very insightful.
Tom Banton has a T20 SR of 160 after 25 dismissals. That’s too few innings to be confident in him maintaining that scoring rate, but enough to say he’s probably a 140+ SR batsman.
Another recent example comes from Dawid Malan:
I don’t know what else I can do to break into the team for the T20 World Cup. I don’t know how you can be under pressure with an average over 57 and a strike rate over 150
Dawid Malan, Sky Sports Cricket Blog
Malan has done very well in his nine T20Is. Yet that tells us little about how we would expect him to perform in the future. Fortunately, T20 players get a lot of stamps in their passports- Malan scored at 145 per 100 balls in the Banglasdesh Premier League and 148 in the most recent Blast. It’s just a case of doing the legwork to calculate an expected Strike Rate at international level. I’ll leave it to the T20 experts to work out whether Malan is worth a spot in the World Cup squad.
Of England’s current players, only Roy and Morgan have more than 30 completed innings in T20Is. There’s insufficient international data. Yet most batsmen have played over 100 innings in T20 leagues – plenty to have a good read on them.
Summing up, there’s too few T20Is to use them to set expected average/strike rate in later T20Is. Far better to set this expectation based on club stats, adjusted for difficulty. There’s even enough data to weight analysis towards more recent performances. Also, beware small sample sizes: even 30 completed innings are too few. Anything under 100 innings and you should apply some judgement to the data.
Averages are the currency of red ball cricket. We know they get misused (eg. after just a handful of games Ben Foakes averages 41) and when abused they have little predictive power. What I hadn’t realised is just how limited averages are: we almost never have a satisfactory sample size for someone’s average to be the definitive measure of their ability.
Number of innings before you can rely on an average
We can all agree that averages after a couple of innings are of very little value. By “value” I mean predictive power: what does it tell you about what will happen next?
Ben Foakes averaging 42 after five Tests doesn’t mean a lot. But how about Keaton Jennings averaging 25 after 17 Tests?
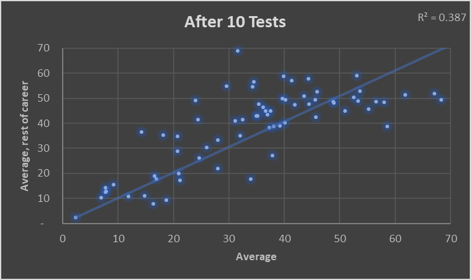
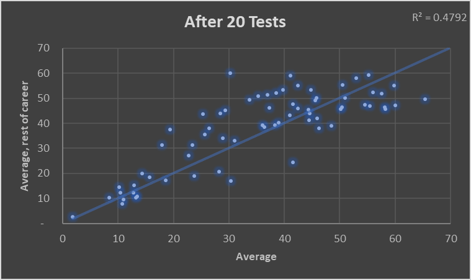
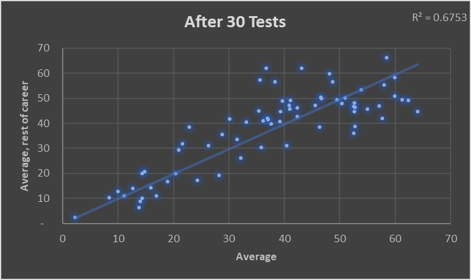
The below charts show the limitations of averages by comparing them after 10/20/30 Tests (x-axis) with those players’ averages for the rest of their careers (y-axis). The sample is players since 2000 who played more than 70 Tests.
It’s quite striking how dispersed the data is. Not just the 10 Test version (Stuart Broad averaged more than Steve Smith), but even over a longer horizon: Michael Vaughan averaged 53 in his first 30 Tests of this century, then 36 in his last 50 Tests (32% less).
Modelling and True Averages
Sports models are often positively described as “simulating the game 10,000 times”. This isn’t just to make the model sound authoritative, it can take that many simulations to get an answer not influenced by the laws of chance. When I look at an innings in-running, balancing speed against accuracy, I’ll run at least a thousand simulations – any fewer and the sample size will impact results. An example from today – Asad Shafiq’s expected first innings average was 55, yet a 1,000 iteration run of the model gave his average as 54.3. Close, but not perfect.
Shouldn’t it be the same with averages? If we don’t have a thousand innings, lady luck will have played a part. We never have a thousand innings.
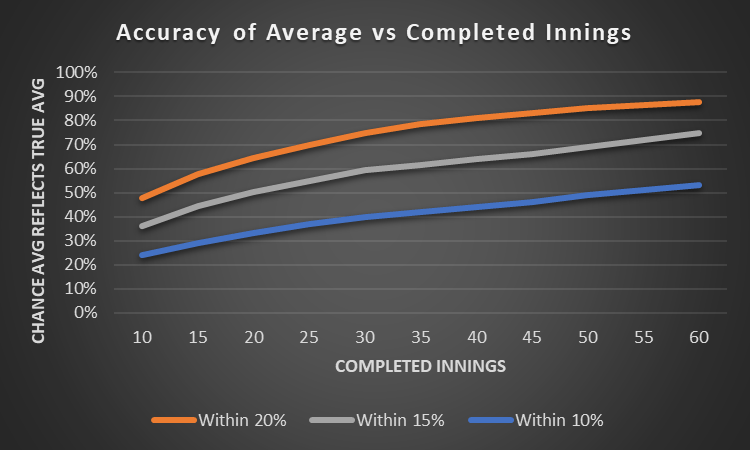
Looking at modelled data, I find that after 35 innings (c. 20 Tests), there is still a one-in-five chance that someone’s average differs by more than 20% from what they would average in the long term. A batsman that would average 40 in the long run could, through bad luck, average 32 after 20 Tests.
Fig 2 – Theoretical evolution of average and how it converges with true average (based on Red Ball Data model).
Sir Donald Bradman had a 99.94 average at the end of his career (70 completed innings). There’s a c.40% chance his average would have been +/- 10% if he had played enough innings for his average to have been a true reflection of his ability. We don’t know how good Bradman was*.
Implications
Don’t blindly slice & dice averages – they’ll tell you a story that isn’t true. Yes, if you have a mechanism to test (eg. Ross Taylor before and after eye surgery), there might be a real story. But just picking a random cutoff will mean you misread noise as signal (Virat Kohli averaged 44 up to Sept 2016, but 70 since then).
Use age adjusted career averages as a best view of future performance.
First Class data has to be a factor in judging Test batsmen, even when they have played 30 Tests. Kane Williamson averaged just 30 in his first 20 Tests. Credit to the New Zealand selectors for persevering.
There has to be a better metric than batting average. Times dismissed vs Expected Wickets times (Strike Rate / Mean Strike Rate) is one that I’d expect to become commonplace in future. Another might be control % in the nets. Yes, I went there: I believe there is some merit in the “he’s hitting it nicely in the nets” line of reasoning.
This analysis can be repeated for 20-20 – I’ll cover that in my next post.
Further reading
Owen Benton already covered the modelled side of averages here. His found an 80% chance that a batsman’s average is within 20% of their true average after 50 innings, which is in line with my modelling. His approach is rather practical: what’s the chance an inferior batsman has the better average after x innings?
*Factor in Bradman’s 295 completed First Class innings at an average of 95 and we can get precision on how good he was. But that sentence would lack punch, and this blog’s barely readable at the best of times.
During a rain delay at Johannesburg last week, the radio commentators were putting an all-time England XI together. The usual arguments ensued: how can you compare players across eras? Is bowling average the sole measure? While looking at something quite unrelated, I realised I’d stumbled upon a new way of comparing players which is perfect for this question.
The metric is “percentage impact on batsman’s average”. For instance, batsmen generally scored 31% below their average facing Malcolm Marshall, making him the best Test bowler of the last 50 years.
Here’s the bowlers since 1970 with at least 150 wickets at under 25 apiece, ranked by their impact on a batsman’s average:
Fig 1 – Impact on Batsman’s average, leading bowlers of the last 50 years in Tests. Note that these have been adjusted to reflect players like Ravi Jadeja who has mostly played at home, mainly when conditions favour a second spinner.
There are four other players whose average flatters them, where Impact on Batsman’s Average is a better metric. Joel Garner picked up 92 of his 259 wickets against a mixed England team. Muttiah Muralitharan and Waqar Younis benefited from a disproportionate number of games against Bangladesh, Zimbabwe and (in Younis’ case) Sri Lanka. Wasim Akram is the hardest to explain: 38% of his wickets were against batsmen with career averages under 20 (a 25% figure would be more normal).
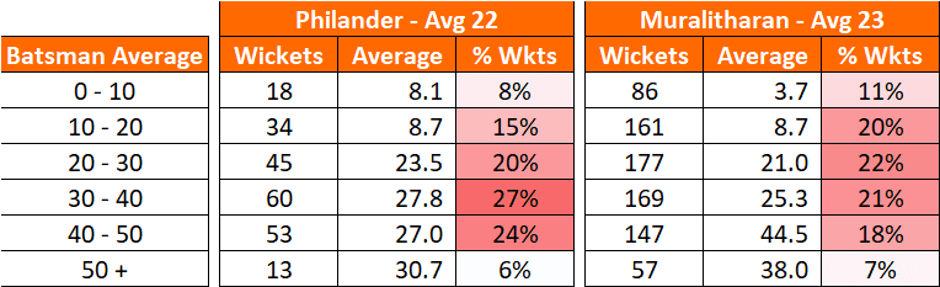
Did you spot Vernon Philander muscle in at fourth on the list? A phenomenal bowler. His average (and Impact on Batsman’s average) may be boosted by favourable conditions where he happened to play most of his away games: England, Australia and New Zealand. Still, I won’t fudge the numbers: he has a brilliant record and South Africa will miss him.
Here’s a comparison of Philander and Muralitharan
Fig 2 – Philander was better than Muralitharan.
Contextual Averages
England have been defending Joe Denly’s average (30) lately by saying that his performances are better than they appear because of the conditions he has played in.
This piece supports that approach: Marshall and Garner had the same bowling average, but Marshall was 10% better than Garner. If averages can mask that kind of difference over a whole career, imagine how skewed an average could be after ten Tests.
Further Reading
ICC’s all time rankings. The ICC have listed players according to their peak performances, while I have used their career. Consider Akram – his average puts him fourteenth on the list, but accounting for who he dismissed the ICC rankings take him all the way down to 76th. That supports my calculations that he had a -11% impact on batsmen’s averages.
How can you tell if a bowler is better than average? They cause batsmen to underperform.
Muttiah Muralitharan troubled batsmen to the extent they averaged eight runs per wicket fewer than over their careers. Mark Boucher averaged a paltry 21 against Murali, whilst his career average was 30.
So what? Well, dear reader, the title of the piece gives you a clue where this is going.
***
DRS was first used in a Test match in 2008, and subsequently rolled out at the back end of 2009. This led to an increase in LBWs for spinners as the technology changed perceptions of how often spinners were delivering balls that would hit the stumps.
Fig 1 – percentage of bowled and LBW for leading off spinners this century (excludes Jeetan Patel, who evenly spanned both decades).
The chart shows a notable increase in the proportion of bowled and LBW dismissals for spinners in the 2010s.
Fig 1 indicates that off spinners only got a little benefit from DRS. This makes sense: coming over the wicket they can’t bowl too straight as that opens up run scoring opportunities. Turning the ball in to the right hander from outside off gives the batsman an escape route (by ensuring contact with the pad is outside the line of the stumps).
Now look at the left handers. A revolution. Instead of 30% of wickets coming from bowled/LBW, that rocketed to 45%. A simple post-DRS approach for an off spinner is to come round the wicket to a left hander and pitch on off stump. Any big turn catches the edge; while no turn means bowled/LBW are in play. Pre-DRS left handers had the opportunity to get a good stride in and using the pad as first line of defence. That doesn’t work with ball tracking. The camera knows.
***
UPDATE 31st JAN 2020 – In the below table, columns “RHB impact” and “LHB impact” were based on potentially inaccurate data. I need to do more work to prove this – so please don’t rely on it for now.
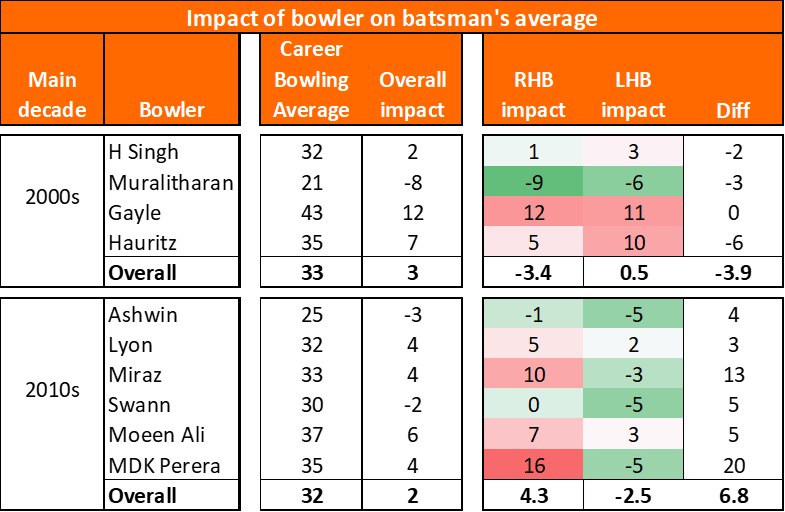
Fig 2
Fig 2 is a ruddy goldmine. Let’s break it down.
First two columns: the player and the decade they mainly played in
Third column: career average
Fourth column: impact on the averages of the batsmen they bowled to. The better the bowler, the lower this number would be. For an average Test cricketer this number would be nil. Calculated by comparing (runs conceded against each batsman) to expected runs conceded (wickets taken * batsman’s average).
Fifth to seventh columns split the Bowler Impact metric between right and left handed batsmen
In the 2000s, left handers were the batsmen of choice to counter a strong off spinner. Only thee batsmen averaged more than 52 against Muralitharan – all were left handers*. A left hander against Murali could expect to average three runs more than his right handed equivalent.
However, that benefit reversed last decade. The hunter has become the hunted. Swann and Ashwin didn’t adversely affect right handers’ averages, but lopped five runs per innings from left handers.
That point is really interesting, so I’ll say it again another way. It’s wrong to see Graeme Swann as a very good Test bowler against everyone – he was average against right handers yet brilliant against lefties. That averages out to “very good”.
Conclusions
A bowler’s ability can be represented by their impact on a batsman’s average, as an alternative metric to bowling average.
Off spinners represent a clear and present danger to left handers.
The general case for matchups in Tests: RHB +8%, LHB -13% vs Off Spin. RHB -7%, LHB +14% vs Leg Spin.
Previously I’d adjusted a batsman’s expected average to reflect the bowling attack’s averages. Will need to add to that the type of bowler and whether the batsman is left or right handed.
I’m working on the basis that all off spinners are alike – explicitly assuming relative performances of right/left handers against a particular bowler are the result of low sample sizes.
Will look at left arm pace and slow left arm bowlers next.
*Qualification criteria: dismissed four or more times
Further reading
Ricky Ponting argued for Australia to favour right handers in the 2019 Ashes to nullify the threat of Moeen Ali.
My statistical goal is a theory of everything: expected averages for any situation. So far I’ve excluded the influence of match ups (specific bowler vs batsman) as being Very Difficult Indeed. That ends now: join me as I dip a toe into that field, starting with some analysis of leg spinners in Tests.
**Update 24/04/2020 – the methodology below was flawed: the Statsguru page I used reflects the score a batsman was on when dismissed, rather than the head-to-head score. Interestingly, after further work it looks like the conclusions were reasonably accurate, even if the workings weren’t.**
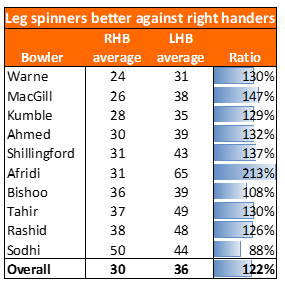
1. Leg spinners and favour right handers
The logic for it being more expensive to bowl leg spin (LS) against left handed batsmen (LHB) in white ball cricket is that the batsman can play with the spin, and minor errors in line provide opportunities for scoring. Here’s CricViz on that topic.
In longer format cricket, I expected leg spinners to be agnostic to the batsman’s stance. Against right handers (RHB) a straight line threatens every kind of dismissal apart from timed out, while for LHB a line well outside off can still threaten the stumps and both edges, while asking the batsman to play well away from their body.
What does the data show? At the highest level of Test Cricket, nine of the ten leg spin bowlers sampled favour right handers. Expect a leggie to average 22% more against left handers in Tests.
Shane Warne took 708 Test wickets at 25, yet against LHB he was average. Still, that makes him significantly better than his competitors – none of the other recent leg spin bowlers averaged under 35 against LHB. What’s the reason? I think it’s the required line against left handers making bowled and LBW less likely. Against right handers bowled and LBW make up 37% of dismissals. For left handers that drops to 31%.
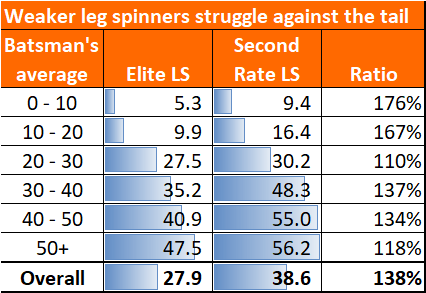
2. Elite leg spinners come into their own against the tail
There’s a neat split between Warne, MacGill, Kumble, Ahmed and the rest. The top four took 1,742 wickets at 28, while the other six took their wickets at 39. Individually, there’s not enough data on the six lesser players – so I’ve lumped them together to compare their careers to the elite four.
The ratio of Elite vs Second Rate averages reveals the trend: Elite leg spinners bamboozle lower order batsmen (anyone with a career average under 20).
What does this mean for strategy? Captains will intuitively know that a strong leg spinner is an asset against the tail. If you have an inferior leg spinner, how should you deploy them? I would argue they are best used against the top order (once the ball is no longer new), in order to keep the best bowlers fresh. It’s a question of managing resources and getting the best out of the attack over a 90 over day.
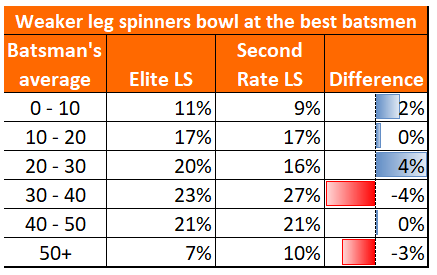
3. Elite bowlers are flattered by bowling at weaker batsmen
The weaker leg spinners claimed 58% of their wickets against batsmen who average 30+. For the elite four that figure is just 51%.
The above impact can flatter averages; for instance Stuart MacGill (42% wickets against top order, career average 29) was not so much better than Devendra Bishoo (61% wickets against top order, career average 37).
A full system would include this when rating bowlers: a rough estimate says MacGill’s true rating was 31, whilst Bishoo’s true average was 35. A quick check shows these adjusted averages are more in line with FC averages, indicating there’s a ring of truth to this.
Methodology
I’ll level with you – there are some assumptions here. Cricinfo’s excellent and free data gives a bowler’s averages split by batsmen (here’s MacGill’s). However, this doesn’t cover how many runs were conceded against batsmen who they haven’t dismissed. I’ve attributed the unallocated runs to batsmen in proportion to their average and number of matches played against that bowler.
***
That was fun! We’ve seen a hint of what matchups can do and I’m very late to the party. That said, I’ll stick to my guns: most patterns are just data mining and we need proper evidence (at the level of the above or better) before drawing conclusions. Those conclusions are best done at the “off spinner vs opening batsman” level rather than the “Moeen Ali to Dean Elgar” level.
I was on the latest Cricket only Bettor podcast talking about promising Test cricketers. Here are my thoughts in more detail.
It can be difficult to judge Test players after a few innings. Their Test average is likely to be meaningless. First Class records feature innings played a decade ago. The concept of “First Class” is lovely, but not all FC bowling attacks are created equal. South Africa has two levels of FC cricket, England has a couple of rounds of games against students each year.
I’ve used player records over the last four years in the top First Class tournament of their country to pick out the best batsmen that are just embarking on their Test career. Note that expected averages below are from here onwards (rather than career averages which should be adjusted up/down based on performances to date).
5. Oshada Fernando. Expected Test average 37
FC avg just 37 over his career, but this rises to 50 over the last four years. Likely to be under-rated. 39 sixes in nine FC matches last season (Jos Buttler gets a six roughly every other FC innings). Also averaged 74 last year.
Test average of 46 comes from four away Tests (in SA and Pakistan). Hit 75* as Sri Lanka beat South Africa 2-0 in South Africa. (Before that only England and Australia had won a series in South Africa).
In December Pakistan soundly beat Sri Lanka in Karachi. Sri Lanka subsided for 212, with only two batsmen passing 20. One of those two was Fernando – he made 102.
4. Rassie van der Dussen. Expected Test average 40.
Took the long route to Test cricket: T20I then ODI experience before being unleashed in whites aged 30.
Tasted success in the 2019 World Cup with three fifties in six innings, even as SA’s campaign faltered (finishing seventh in the group).
Reasons to believe: last four years scored 2,302 runs at an average of 55. Some positive murmurs in the media from his first three Test innings.
3. Zubayr Hamza. Expected Test average 42.
1,563 runs at 50 L4yr. Career FC avg 49.97. Just 24 yrs old, quite a prospect.
Makes the list purely on First Class performances. Top order batsman, Poor start to Test career, but has a higher first class average than van der Dussen. Averaging 21 after eight innings, but I’m keeping the faith
2. Marnus Labuschagne. Expected Test average 45
He’s just racked up the most runs scored by an Australian in a five-match summer. So why isn’t Labuschagne #1? His FC record lately isn’t that good – four year Sheffield Shield average of 35.
His evolution is interesting. Averaged 25 in the Sheffied Shield in 2018/19, and only 26 over his first five Tests to 31st March 2019.
Began 2019 as an unknown (to me) player in an unfancied Glamorgan team but scored 1,114 at 66 and followed that up with a great run for Australia.
Will he keep it up? He’s surely not come from nowhere to be the best since Bradman. Has he? It depends on how you judge a player. One year? Two years? Four years? Their whole career?
1. Ollie Pope. Expected average 48.
Didn’t get past 30 in his first five Test innings, has back to back fifties since then. Missed most of 2019 with a shoulder injury, though that doesn’t seem to have affected his game. Hit an unbeaten double hundred in August against a Hampshire attack with four international bowlers (Edwards, Abbott, Holland, Dawson). Has only played 34 first class matches – so there’s some uncertainty on exactly how good he is.
***
The list started as best batsmen to debut in 2019, but I could only find three batsmen that excited me enough. Thus Pope and Labuschagne got parachuted in and the list was extended to the last 18 months. Honourable mentions go to Mayank Agarwal and Rishabh Pant who would probably have made the cut if I’d been looking at the last 18 months from the start.
The 2010s end today. I’ve no team of the decade for you, just a chart and its implications.
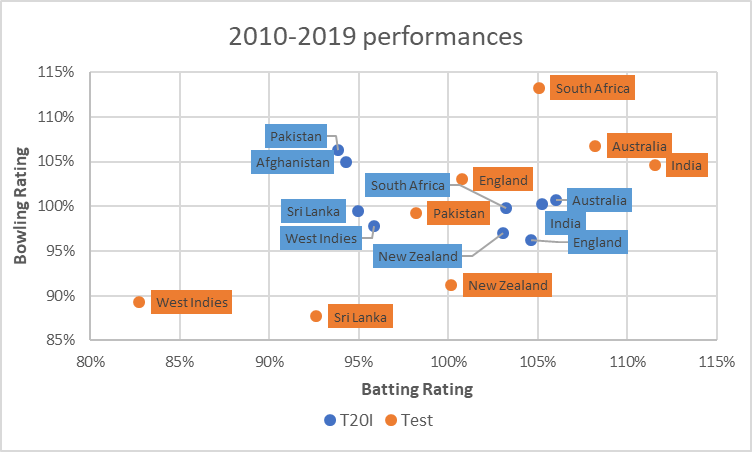
Fig 1 – Batting and Bowling performances in Tests and T20Is this decade. Ratings are based on averages in Tests and Strike/Economy Rates in T20Is. Higher numbers are good – eg. India averaged 5% less with the ball in Tests than the average team. Ireland excluded as played too few games.
The Big Three does not include England in Test Cricket. It’s South Africa / Australia / India based on the last ten years (and the last week).
West Indies were not good at Test Cricket in the 2010s. Their record against the top three teams was W0 L21 D9. Problematic for the sport, if number eight can’t win in 30 attempts against the top three.
T20Is will be closer than the average Test – As well as the obvious (one short innings rather than two long ones) the teams are far more evenly matched in 20-20 than Tests. Australia were one of the strongest teams this decade. Their W/L ratio was 1.5 in Tests but only 1.35 in T20Is.
Bowling is not the differentiating factor in T20Is. This is odd, because weaker bowling should be punished by the six hitting machines out there in 20-20. Look at the distribution of the two colours of dots: the Orange ones for Tests form a line from the bottom left to top right. If you are strong in one discipline you will be strong in the other. It doesn’t work that way for 20-20: batting makes the difference.
Two clusters of T20I performance: the top tier is Australia, India, England, New Zealand, South Africa. The next level down is West Indies, Sri Lanka, Afghanistan, Pakistan.
What happened to New Zealand’s Test bowling this decade? Were they weak for a few years and I didn’t notice?
Please note that apart from points three and four, this chart is backwards looking: it does not have predictive power. Still, sometimes nice to take stock and see the wood not the trees. There’s a lot of noise out there, don’t miss the longer term trends.
Jofra Archer is struggling with the bat in Test cricket, averaging eight and lengthening the tail. Yet he has a First Class average of 26. Is he getting an easy ride batting down the order for Sussex, then being found out at the highest level? Let’s find out.
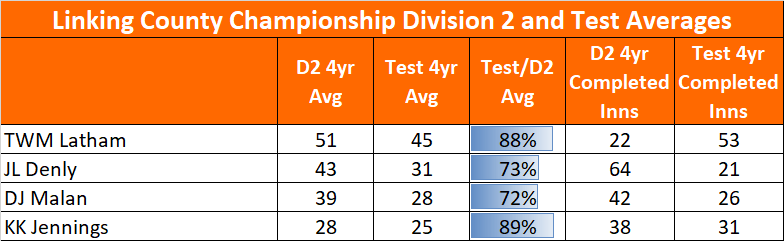
Recap – Linking Division 2 and Test Batting
Previous workings showed that a played would expect to average 72% as much in Tests as they do in Division 2 (D2). There isn’t that much data though: most Test players are drawn from the top division. Just four players have over 20 completed innings at both levels over the last four years:
Not a bad fit – D2 averages do have reasonable predictive power of Test performance for batsmen (please take note Mo Bobat). You just need to play a decent number of games in both formats.
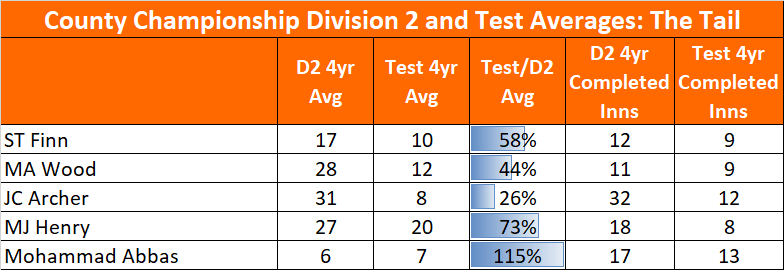
But what about tail enders in Tests?
Most of the overseas players in D2 are batsmen. There aren’t many bowlers in D2 to have also played Test cricket lately. Here’s the data for the five lower order batsmen to have eight or more completed innings in Tests & D2:
Remember none of these players has 20 completed innings in both formats, so expect volatility. Archer and Mohammad Abbas are the outliers: Archer averaged nearly four times as much in D2, while Abbas has a slightly higher Test average.
Across the five players, their Test average is 63% of their D2 batting average (for all players this figure is 72%).
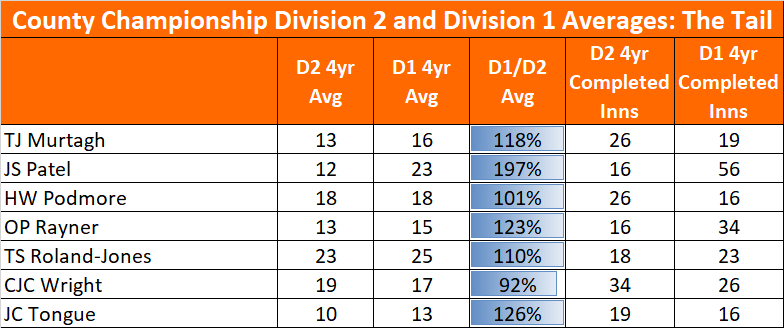
Tail enders in D2 vs D1
Data is lacking on tail enders in D2 and Tests. Let’s answer a different question. If we are happy with the standard of D1, then all we need to do is demonstrate similar averages for the lower order in D2 and D1, and we can conclude that Jofra Archer is good at batting.
The above chart is for all batsmen that have >15 completed innings in D1 and D2. If anything the trend is for higher averages in D1. Can’t explain that, but at least that gives some comfort that the tail isn’t getting an easier ride in the lower division.
Conclusion
Jofra Archer would be a very unusual player if he continues to average under ten in Tests. I would expect him to average 17 in Tests based on all available red-ball innings. It just happens that the County Championship has seen the best of his batting, and Test cricket the worst.
Sporting autobiographies tend to wash over me. A reminder of a forgotten series, but not much more. I was recently given a copy of On Fire: My Story of England’s Summer to Remember by Ben Stokes, and made some notes along the way to keep my focus.
If you have a copy of the book, you might find it insightful to read this analysis alongside it. Page references are for the hardback copy. If you don’t have a copy, the below analysis (hopefully) speaks for itself.
p10 [On Alex Hales] “The collective feeling was that he should have felt comfortable enough in the environment that we had created to let on what was happening”.
Somewhat naive – if someone doesn’t feel able to speak up, it isn’t necessarily their fault. It is easy to think that in any team we have a positive and open culture, though we only find that out when it is tested.
p50 [Moeen Ali explains to Stokes how to succeed in ODI middle overs bowling] “Bowling in one-day cricket, I have found you need to change your mindset. It’s not about trying to get the batsmen out. The building of pressure will lead to wickets”.
Note that this strategy works with a strong batting lineup (as England now have). With mediocre batting, attempting to contain will just get you milked and vulnerable to a late onslaught with wickets in hand. It’s surprising that Moeen is delivering this insight – shouldn’t this come from the management and coaching staff? Maybe this is just being told this way to make a better story.
p66 [On putting Buttler up the order in ODIs] – “I’m normally at the forefront of calls for him to his his pads on once we get beyond the 20-over mark with plenty of wickets in hand.”
Stokes and I have come to the same conclusion. If cricketing experience and modelling are in harmony, one is on fairly safe ground.
p71 / 117 “Don’t wait until you get into the middle to decide how you’re going to play”. / “Jimmy Neesham was in my sights. This wasn’t a pre match plan”.
I like the approach to planning an innings. Yet I wonder what caused this apparent contradiction in approach with Stokes not taking his own advice and winging it against Neesham.
p115 [on Colin de Grandhomme getting Joe Root out] – “he certainly would not have been the bowler expecting to be troubling him had you considered the key match-ups before the final”.
A rare sentence in a book that isn’t big on analytics – does that mean England are using match-ups to plan which bowlers to attack? It doesn’t sound that way from the way Stokes describes his approach to an innings elsewhere in the book. Or is it that this kind of analysis would not be of interest to the target audience so is kept to a minimum?
p121 Stokes tells Jofra Archer (facing the last ball of the penultimate over) not to score a single so Stokes can face the last over. A logical approach to chasing, maximising expected runs from the seven balls remaining. I wonder if they would have made the same choice if batting first? Do teams leave runs unscored because in the first innings there isn’t the same pressure?
p129 sets out how Stokes scored 84* in the World Cup Final then went straight into the super over, scoring 8* (3). Carrying on his innings gave England an advantage – look at how strike rate evolves with balls faced. I estimate this benefit to be worth at least one expected run in a super over. Two insights: consider keeping your not-out batsman at the crease for the super over; also worth looking at whether the team batting first in super overs has an advantage from a gambling perspective.
p172 “Edgbaston … has the best atmosphere”.
There’s a contradiction in Stokes’ writing – he is in a bubble when batting, doesn’t want external factors to influence him, yet the enthusiasm of the crowd matters to him.
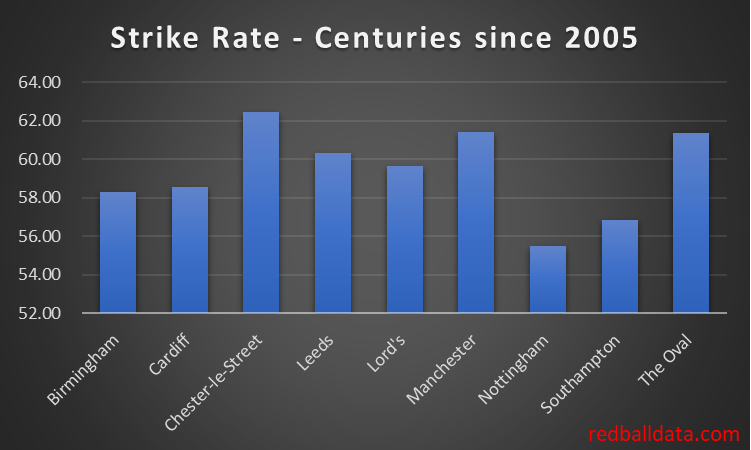
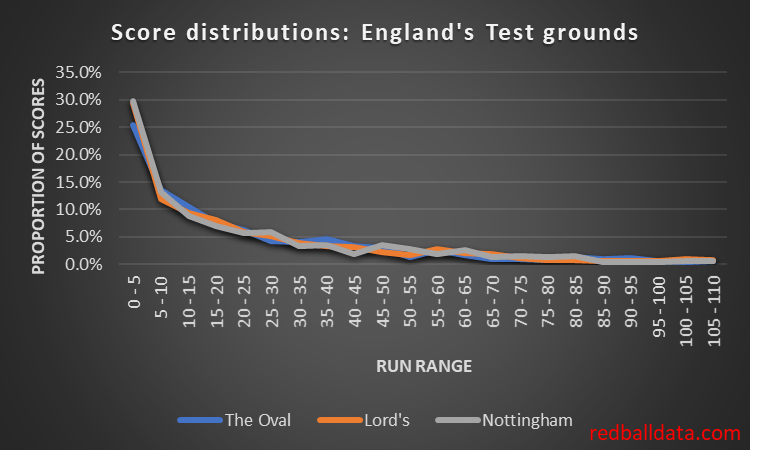
p196 “Lord’s is such a fast scoring ground for a batsman who is in… no matter what the pitch is like… It really can give you 20 per cent more value for your shots than other grounds”. Nice hypothesis, and I know what he means. It isn’t true though. Here’s some charts:
Fig 1: Big scores at Lord’s are not at a higher strike rate than other groundsFig 2: Score distributions by innings are very similar between the most frequently used Test grounds in England. Lord’s doesn’t stand out.
p176 “if an umpire gets overturned from “out” to “not out” by his TV colleague, a reluctance to give more “outs” usually follows.”
That’s believable. Since one-third of lbw reviews are umpire’s call, only c.22% of dismissals are lbw, and only one of the two umpires would be affected, this impact is unlikely to be significant.
p242 [England are nine wickets down, with eight to win. Stokes and Jack Leach are batting well together] “doubts started to creep in as I questioned myself on how to play going forward. Should I continue in the same manner?” Here, Stokes is struggling with a statistical question – the equation has changed. With 73 to win, England just needed to bat to maximise expected runs to have the best chance of winning. In other words, follow the approach I set out earlier this year. However, with eight to win, England needed to give themselves the best chance of scoring those runs. That might mean hitting boundaries off the last two balls of an over – which ordinarily would leave the number 11 facing a whole over, but in this case wins the game. Stokes’ cricketing instincts align with a statistical approach.
p260 Old Trafford is described by Stokes as generally the flattest pitch in the country. I wonder what he means by this – it certainly isn’t the easiest to bat – averages are 9% higher at The Oval in Tests. In ODIs Old Trafford is the lowest scoring of England’s grounds.
Overall, ignore the bits where Stokes talks about his current colleagues (because he will only praise them) and there’s still plenty to get your teeth into. We get a lot of insight into Stokes’ process when batting, and his soft skills as a senior player in the team. I wonder, is this a 304 page application to succeed Joe Root as England Test captain?
David Warner seems to have a preference for familiar conditions. After 82 Tests he averages 66 at home, 33 away. 2019 has been a rollercoaster: averaging 9.5 touring England, then dismissed just three times amassing 551 runs in Australia.
Would we expect that trend to continue? No. I’ll exhibit two bits of evidence against some players being disproportionately dominant at home. Firstly tracking a recent crop of players, and secondly by demonstrating that the great players in home conditions are what we would expect from chance.
Recent History
We consider players that did relatively well at home up to a point in time (31/12/2016), and see if this continued, or if they regressed to the mean.
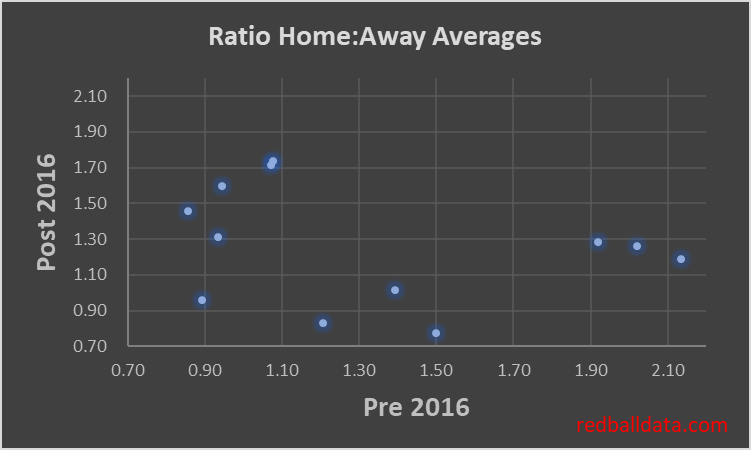
Fig 1 – Home and Away batting averages in Test Cricket. Split before and after 31st December 2016. Min 10 completed innings Home and Away pre 31/12/16, min 20 completed innings Home and Away post 31/12/16. Home advantage means the average player’s ratio is just under 1.2.
The above table indicates Home : Away Average Ratio (HAAR) history is a poor predictor of future returns. Elgar was great then OK. Amla was rubbish then brilliant. Plotting the data shows just how scattered the 12 data points are.
Fig 2 – Home to Away average ratios batting in Test Cricket. Split before and after 31st December 2016. Min 10 completed innings Home and Away pre 31/12/16, min 20 completed innings Home and Away post 31/12/16.
Putting it another way, if you had spent your Christmas 2016 holiday seeking home ground heroes, you would have been wasting your time*. Pujara, Broad and Elgar had HAAR ratios around 2 (just like Warner does now), but past performance is no guarantee of future success – all three of them subsequently performed no better than average.
And the players that favoured touring? Three of the four who were stronger away pre-31/12/16 flipped to subsequently be better at home. The one exception was Ben Stokes: in his career he averages 36 at home and 38 away. Take that nugget with a pinch of salt: if Stokes is better on tour why does he average 44% more batting at home in ODIs?
All time
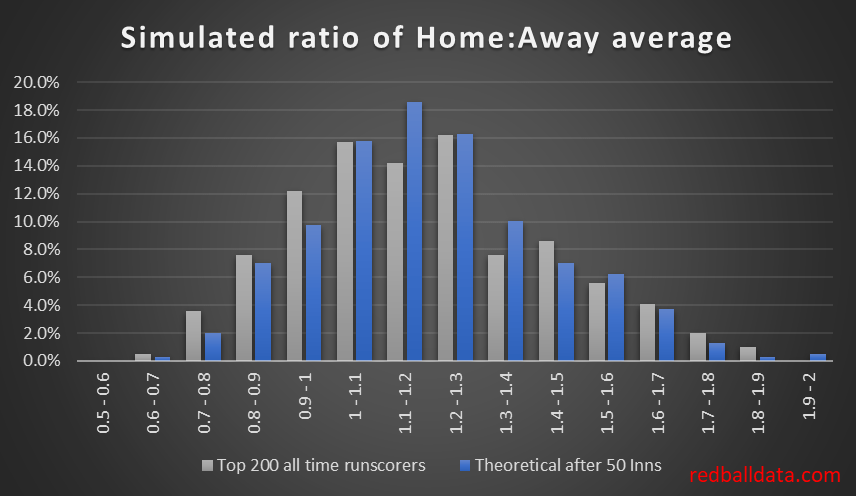
Now to compare HAARs for Test cricket’s highers runscorers vs the theoretical distribution after 50 innings at home and 50 away:
Fig 3 – Actual Home:Away Average Ratios for the top 200 runscorers in Test cricket, compared with a simulation of 50 innings at home and 50 away.
Randomness plays a huge part (possibly up to 100%) in explaining the variation in Home:Away Average Ratios of Test cricketers.
There are other factors I’ve not included (for instance, a player might only struggle in swinging conditions). If there are specific cases where you think a player thrives only at home (or away), then please let me know.
Where does this leave us? Hopefully (for Warner’s sake) he has a few more years of Test cricket in him. That would also be useful for this blog – I look forward to reporting at the end of 2021 that Warner’s HAAR over the last two years has been the standard 1.2, and that past outperformance at home is no guarantee of future success.
*An aside – there’s a line from I Robot “I’m sorry: my responses are limited – you must ask the right questions”. While I wouldn’t normally take lessons from fictional holograms, I like the message in this. You can do decent-looking research, but if you start with the wrong question you’ll be wasting your time. In this example, “who are the best batsmen in home conditions” is the wrong question, one should ask “is there anything special about the ratio of a batsman’s home average to their away average?”