
David Warner seems to have a preference for familiar conditions. After 82 Tests he averages 66 at home, 33 away. 2019 has been a rollercoaster: averaging 9.5 touring England, then dismissed just three times amassing 551 runs in Australia.
Would we expect that trend to continue? No. I’ll exhibit two bits of evidence against some players being disproportionately dominant at home. Firstly tracking a recent crop of players, and secondly by demonstrating that the great players in home conditions are what we would expect from chance.
Recent History
We consider players that did relatively well at home up to a point in time (31/12/2016), and see if this continued, or if they regressed to the mean.

The above table indicates Home : Away Average Ratio (HAAR) history is a poor predictor of future returns. Elgar was great then OK. Amla was rubbish then brilliant. Plotting the data shows just how scattered the 12 data points are.
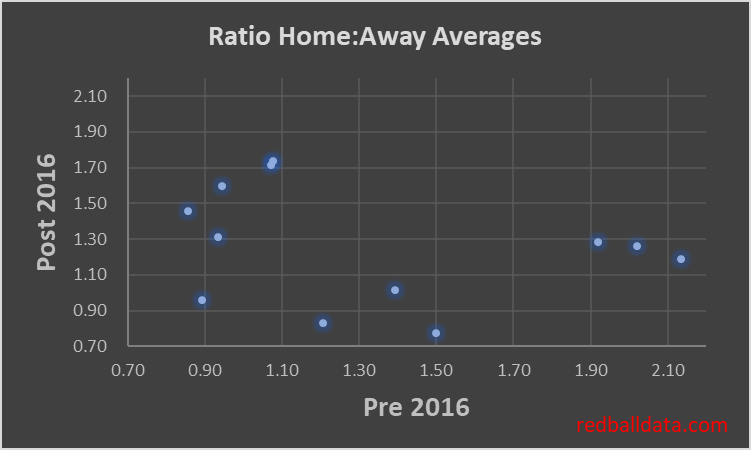
Putting it another way, if you had spent your Christmas 2016 holiday seeking home ground heroes, you would have been wasting your time*. Pujara, Broad and Elgar had HAAR ratios around 2 (just like Warner does now), but past performance is no guarantee of future success – all three of them subsequently performed no better than average.
And the players that favoured touring? Three of the four who were stronger away pre-31/12/16 flipped to subsequently be better at home. The one exception was Ben Stokes: in his career he averages 36 at home and 38 away. Take that nugget with a pinch of salt: if Stokes is better on tour why does he average 44% more batting at home in ODIs?
All time
Now to compare HAARs for Test cricket’s highers runscorers vs the theoretical distribution after 50 innings at home and 50 away:
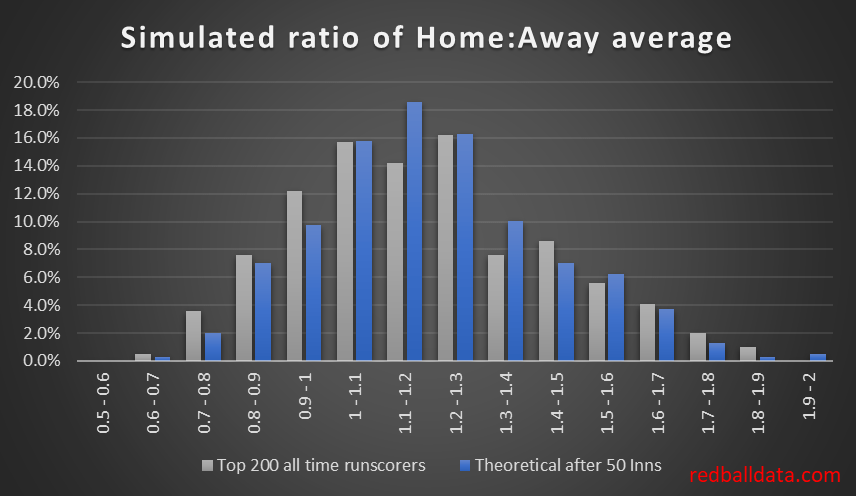
Randomness plays a huge part (possibly up to 100%) in explaining the variation in Home:Away Average Ratios of Test cricketers.
There are other factors I’ve not included (for instance, a player might only struggle in swinging conditions). If there are specific cases where you think a player thrives only at home (or away), then please let me know.
Where does this leave us? Hopefully (for Warner’s sake) he has a few more years of Test cricket in him. That would also be useful for this blog – I look forward to reporting at the end of 2021 that Warner’s HAAR over the last two years has been the standard 1.2, and that past outperformance at home is no guarantee of future success.
*An aside – there’s a line from I Robot “I’m sorry: my responses are limited – you must ask the right questions”. While I wouldn’t normally take lessons from fictional holograms, I like the message in this. You can do decent-looking research, but if you start with the wrong question you’ll be wasting your time. In this example, “who are the best batsmen in home conditions” is the wrong question, one should ask “is there anything special about the ratio of a batsman’s home average to their away average?”
