
Sri Lanka won a thriller last week (link), chasing down a target of 304 with one wicket in hand. The unbroken last wicket stand of 78 came out of nowhere. If they had been opening the batting for England, this would have been the ninth highest of the last 100 partnerships.
How common are these monster scores?
Considering tenth wicket partnerships since 2000, the Mean score is 14.5 runs, the Median eight, and the mean duration is 25 balls. The chance of scoring 78 or more is roughly 100-1. [1]

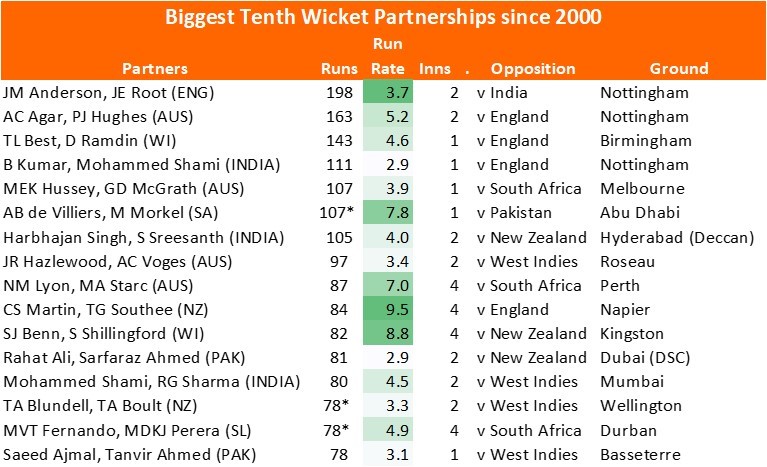
That tells us that very high scores are rare, but what about the big scores – are there any patterns here?
- Bias towards the first innings of the match
- Most involve a top order batsman with the number eleven
- Three blisteringly fast run-a-ball partnerships; most are significantly faster than the average 3.0 runs per over for Test Cricket in this era.
Modelling tenth wicket partnerships
If you have two openers that average 40, you can model the partnership as if it is one batsman that averages 40 – the distribution of scores will be the same. This holds true until you have batsmen with wildly different averages. What would you expect a partnership to yield when a top order batsman is left with a number eleven for company?
A model of expected average for a tenth wicket partnership was created, using the following inputs: each Batsman’s Career Average, Home/Away and the innings number within the match. Various combinations of the two batsmen’s averages were tested against the data since 2000. [2]
Results were tested in two ways. I) Measuring the mean square difference between expected and actual partnership, and II) Seeking a distribution where half the scores are above and half below the expected distribution
The best fit was that the partnership average is: Weaker batsman’s average + 20% of the difference between both batsmen’s averages.
Returning to Sri Lanka’s match winning partnership, Perera (Avg 35) and Fernando (Avg 7) would be expected to average (7) + (35-7)*0.2 = 12.6 for the tenth wicket. Adjust for it being the fourth innings, and being away from home, and the expected average drops below 10. Something else is missing – or that 78 partnership is still a miracle!
Strategy and Strike Rate
If the number eleven bats defensively, that gives more time for the senior batsman to score runs: the partnership for the tenth wicket is likely to be more lucrative.
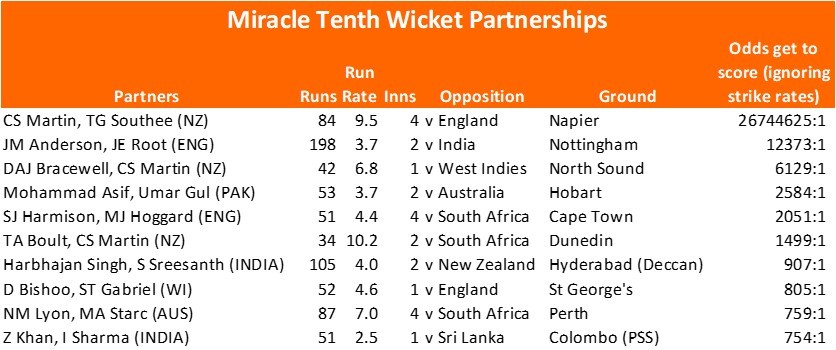
Think Chris Martin – he averaged 2.5, but at a Strike Rate of 20 runs per 100 balls. Martin could expect to stick around for 12.5 balls. If he scored at a Strike Rate of 50, he would only last an average of 5.0 balls, and there would quickly be a marooned batsman at the other end.
Ignore Strike Rate and the 84 Chris Martin put on with Tim Southee in 2008 (link) was a one-in-27 million event. Adjust for bludgeoning Southee and circumspect Martin and that drops to 1,500-1.
There is an unquantified boost to the expected partnership through farming the strike to ensure the senior batsman faces more balls. Another increase comes through aggressive batting by the senior batsman. I will consider adding those factors to my Test Match Cricket Model, so it better reflects the reality of occasional monster last stands.
Conclusion
- Expected value of the tenth wicket: Weaker batsman average + 20% of the difference between both batsmen’s averages.
- A last wicket partnership is more successful if the number eleven defends, leaving the attacking batting to the senior batsman. If numbers ten and eleven are batting together, they should bat naturally.
- More very high partnerships than my model expects, driven by attacking batting.
Further reading on batting partnerships
A powerful story, NSFW (because it is something of a tearjerker) https://www.cricketcountry.com/articles/bert-sutcliffe-and-bob-blair-at-ellis-park-a-fairytale-bigger-than-cricket-287471
A paper on batting strategy and partnerships in Tests. Limited in that it covers the general case, rather than a player-specific model. https://pdfs.semanticscholar.org/786b/fa723eb721b66fd6023b4a6f56394968087c.pdf
[1] 100-1 odds for an average last wicket pair. The 600-1 for Sri Lanka reflected the fourth innings, against a fantastic South African bowling attack.
[2] Note that only batsmen with more than 30 career innings were included and matches involving Bangladesh are excluded.

Enjoyed that. It would also be interesting – but with publicly available data, not currently possible – to explore fielding teams’ tactics against end of innings partnerships. Attack the senior batsman (both in terms of line/length and field placement)? Frustrate attempts to farm the strike? Etc.
LikeLike
Thanks. I hope there’s more that can be done with the publicly available data- I might have a look at long term number elevens (like James Anderson) and see what impact the last man’s strike rate (as a proxy for batting intent and risk taking) has on the tenth wicket partnership.
Tactics were something that I wish I could cover (eg. Number of slips vs tenth wicket partnership size).
LikeLike