Bob Willis Trophy preview: part two

It’s the evening before the county season starts, and the squads have been announced. That means I can tell you which teams have the best chance of success.

Here’s a unique preview – data driven, based on each player’s red ball performances in the last four years. Most previews name a couple of stars, “one to watch”, and throw in some juicy facts and interviews. Redballdata.com sadly has none of this.

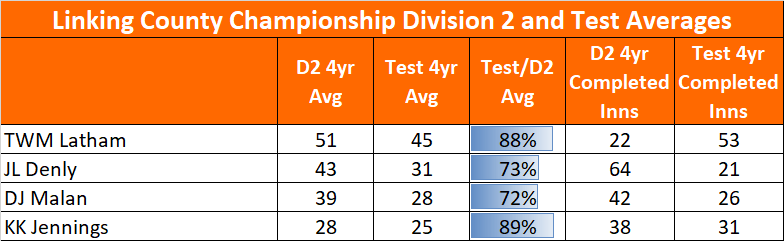
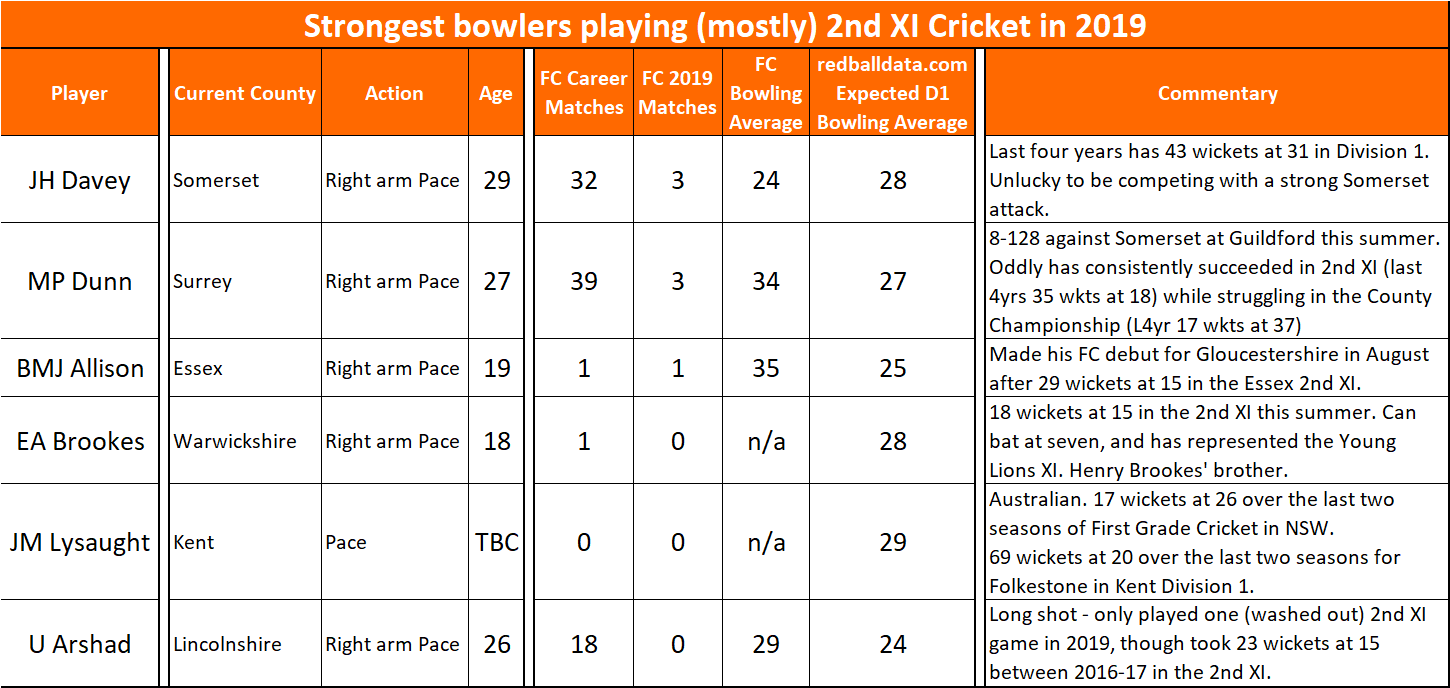
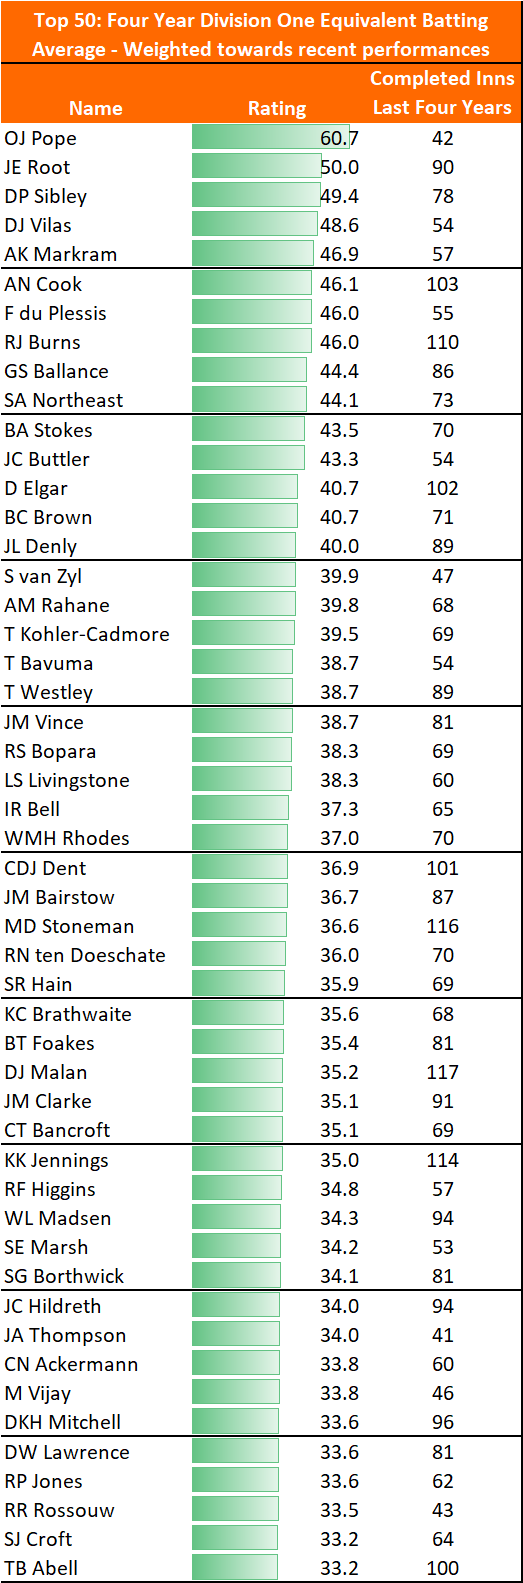
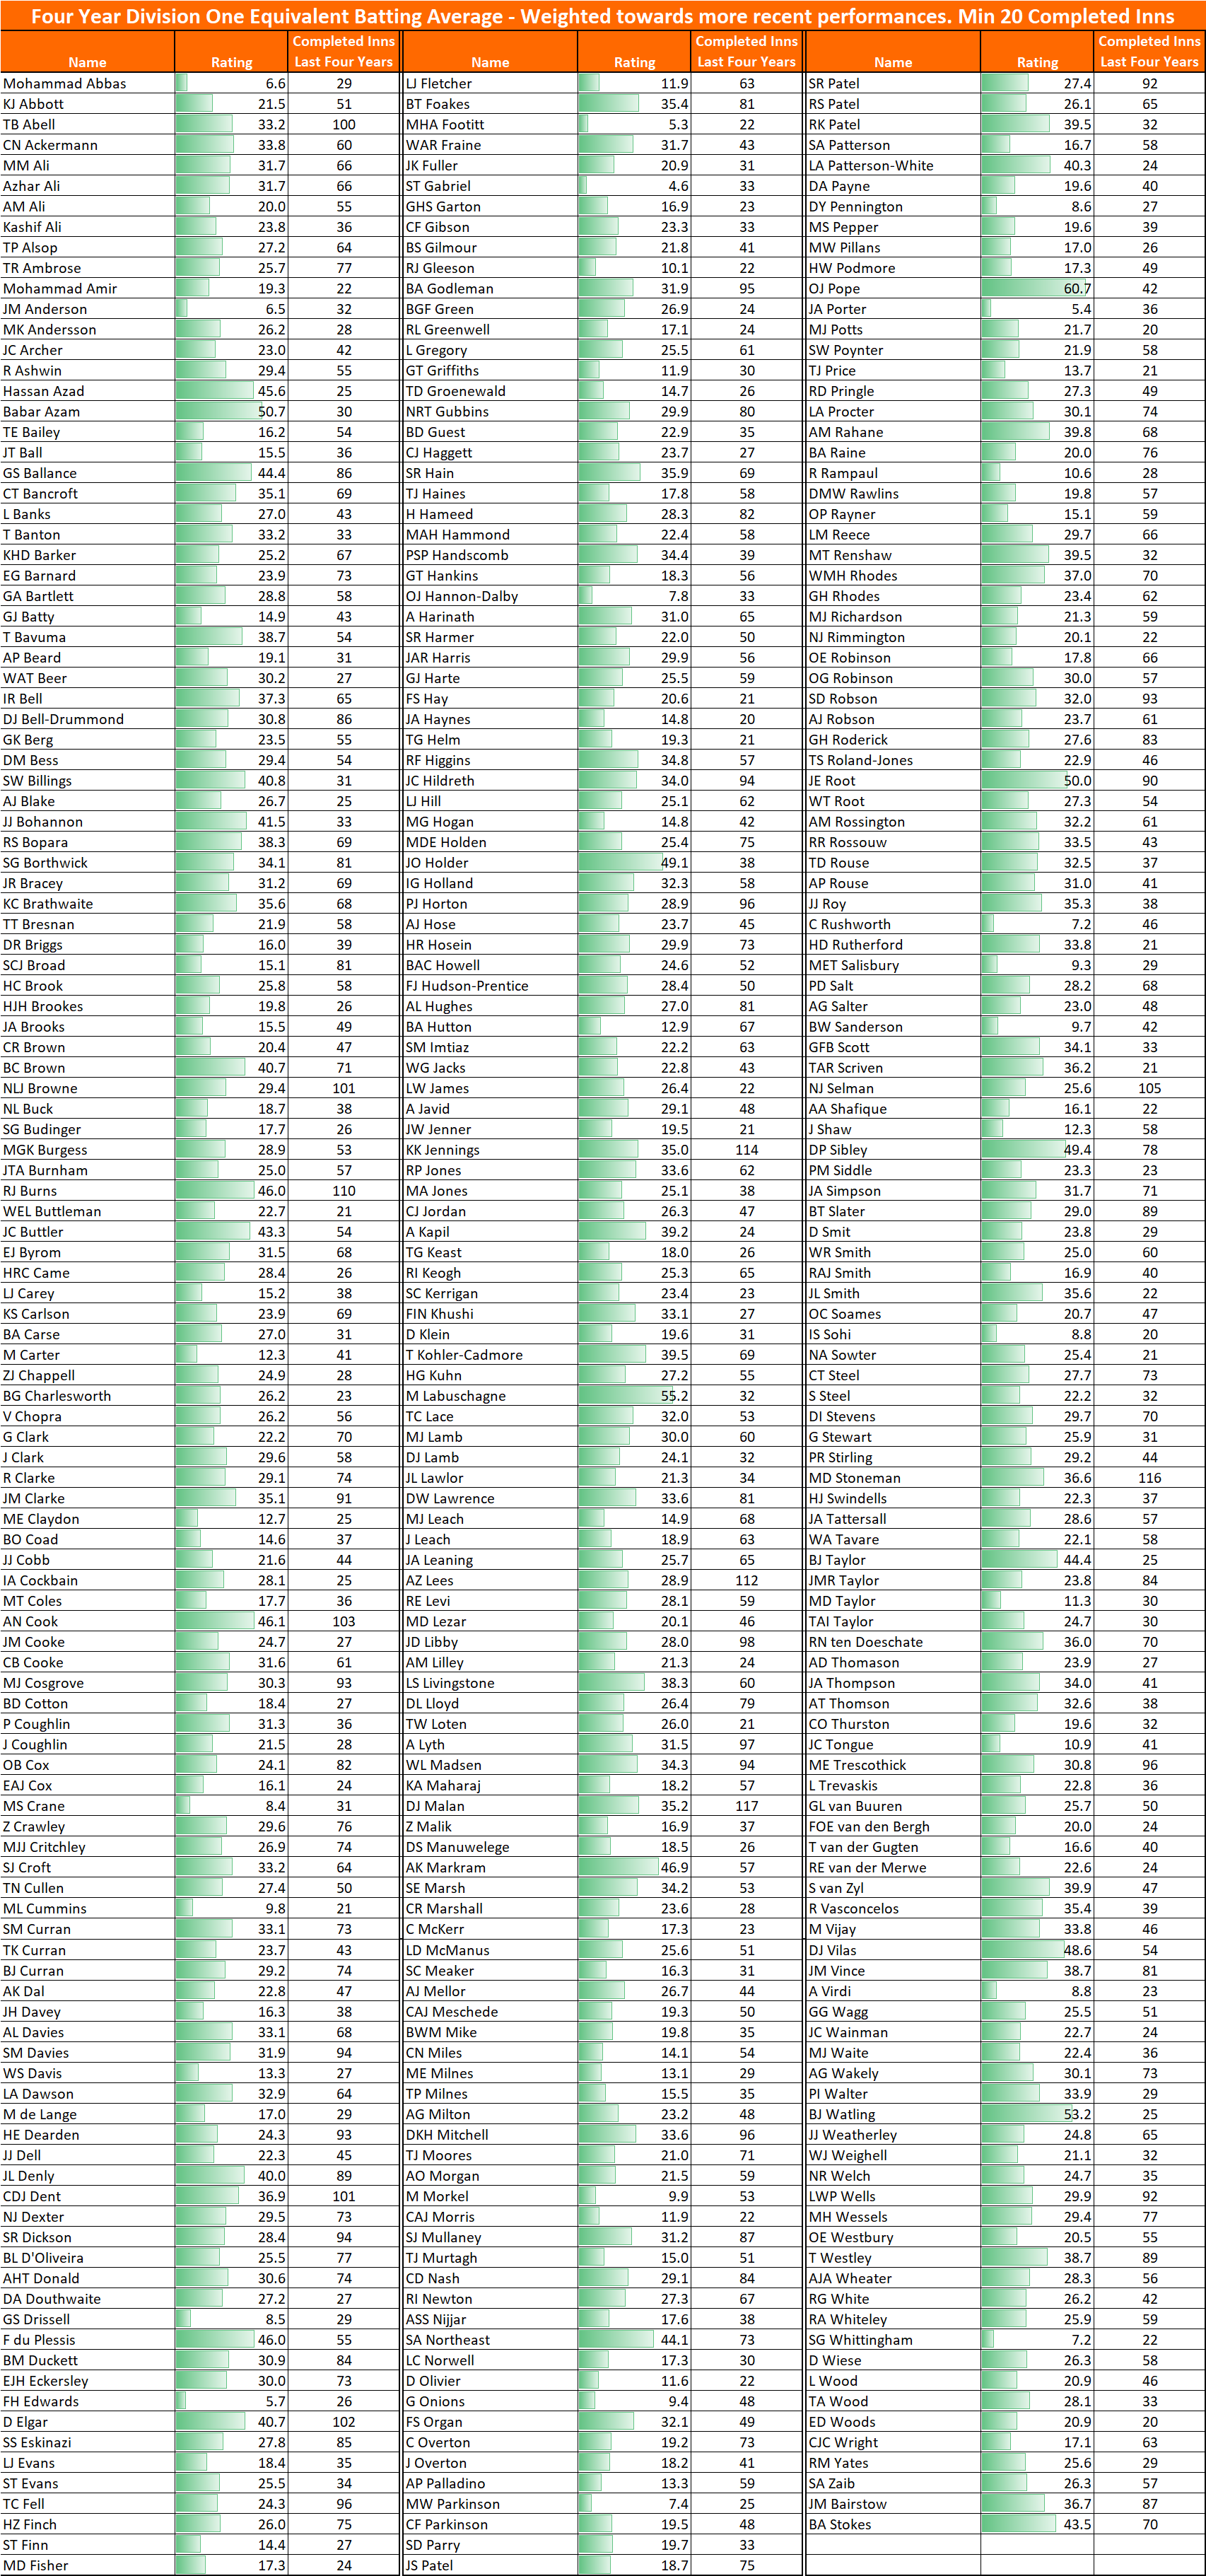
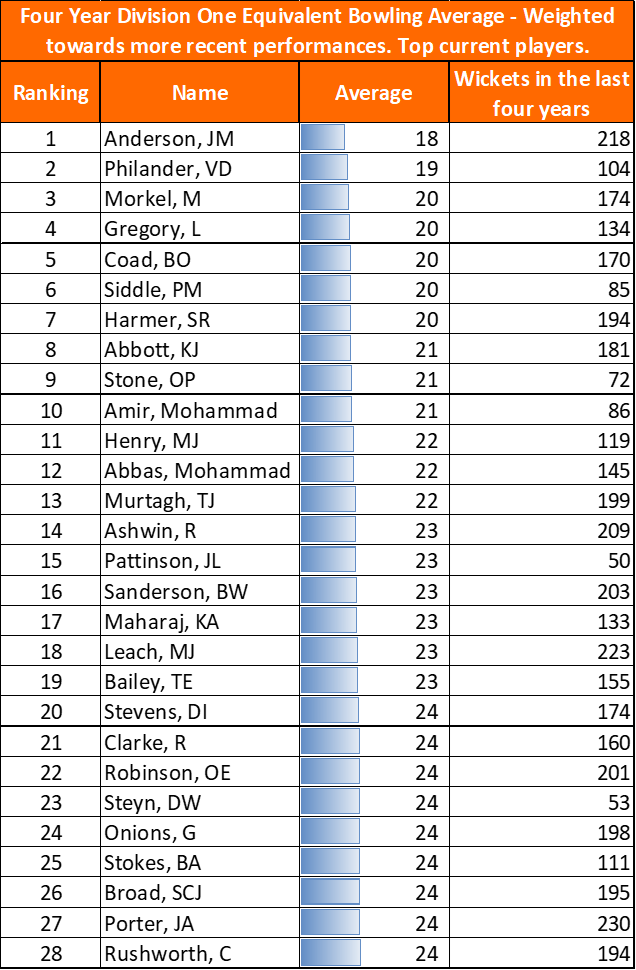
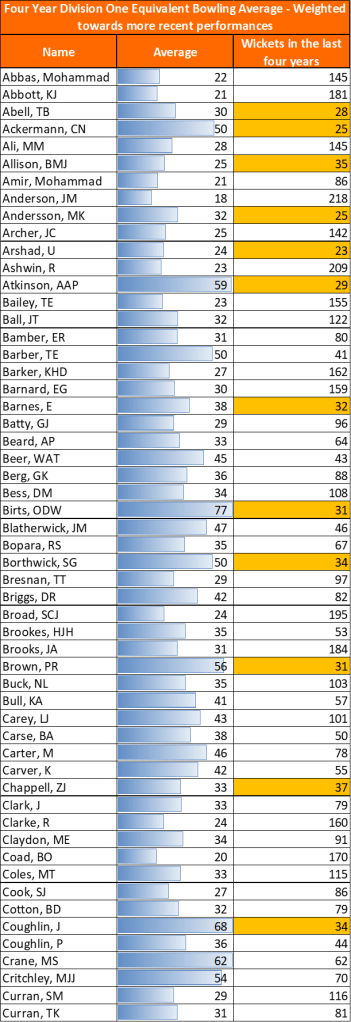
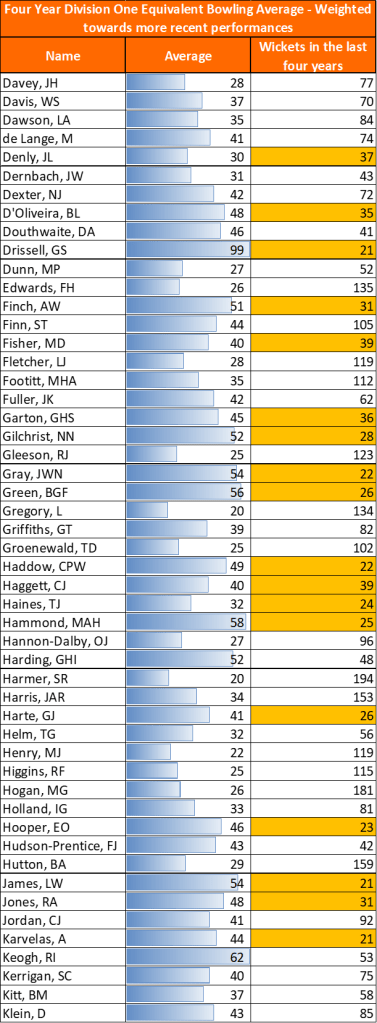
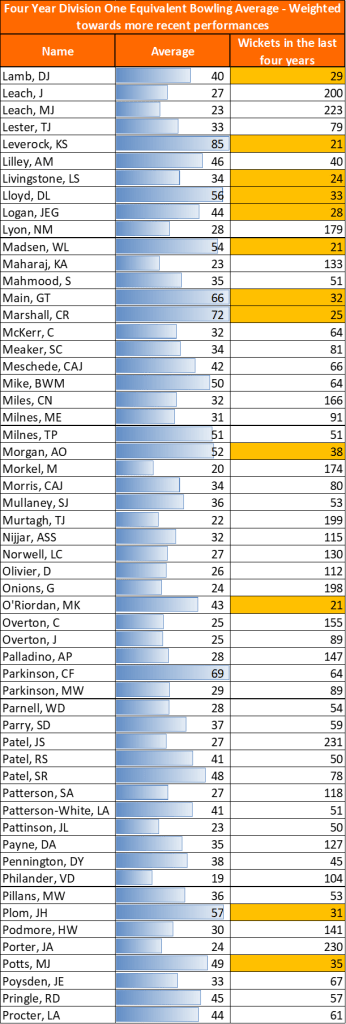
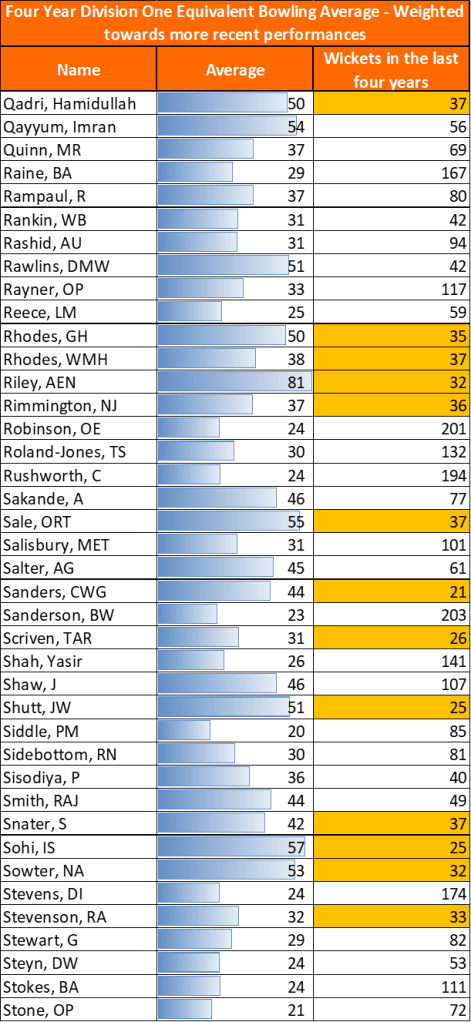
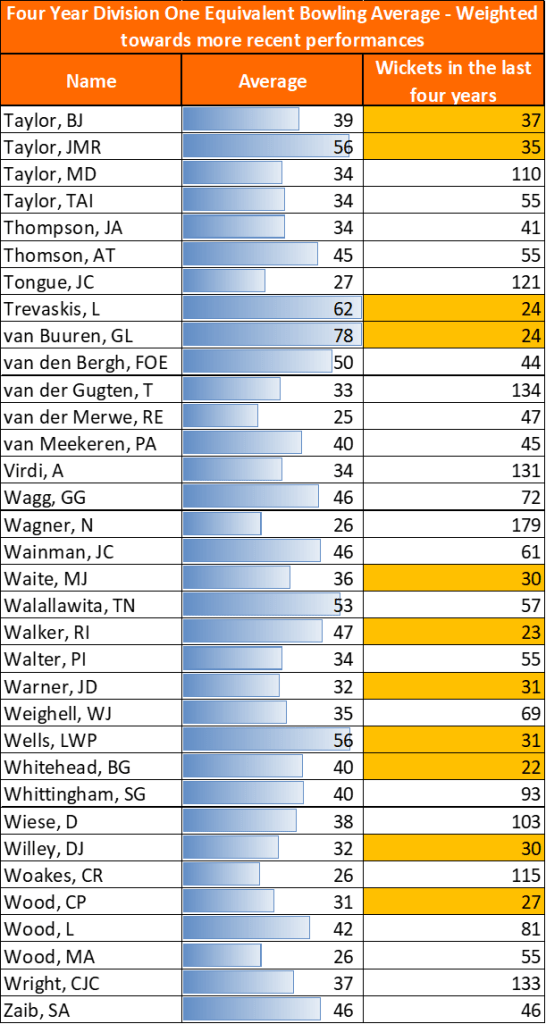
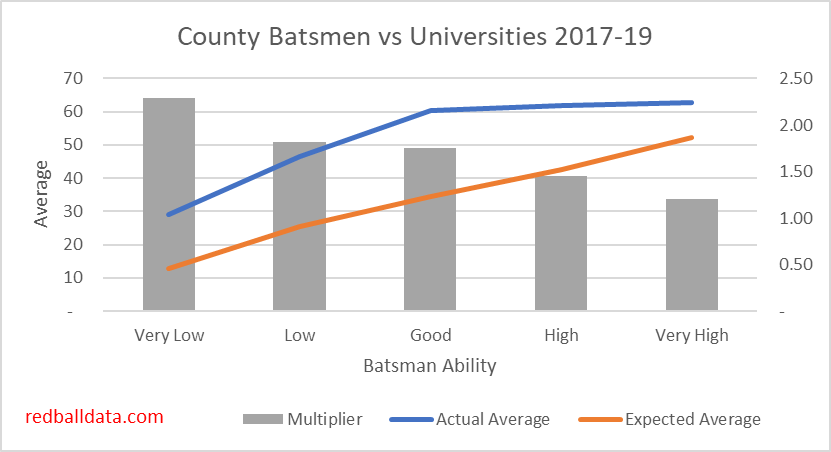
So how can I help you? Without the Test and overseas players, we’ll see lots of talent emerge from the 2nd XI. You and I may not know the names, but I’ve rated those players. The database uses the last four years’ data for Test, county, and 2nd XI Cricket, adjusted for difficulty. For each group, I’ve ranked teams in order of strength, and below the commentary you can zoom into each squad to see the individual rankings.

The North Group

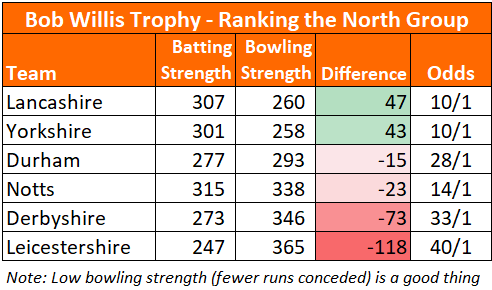
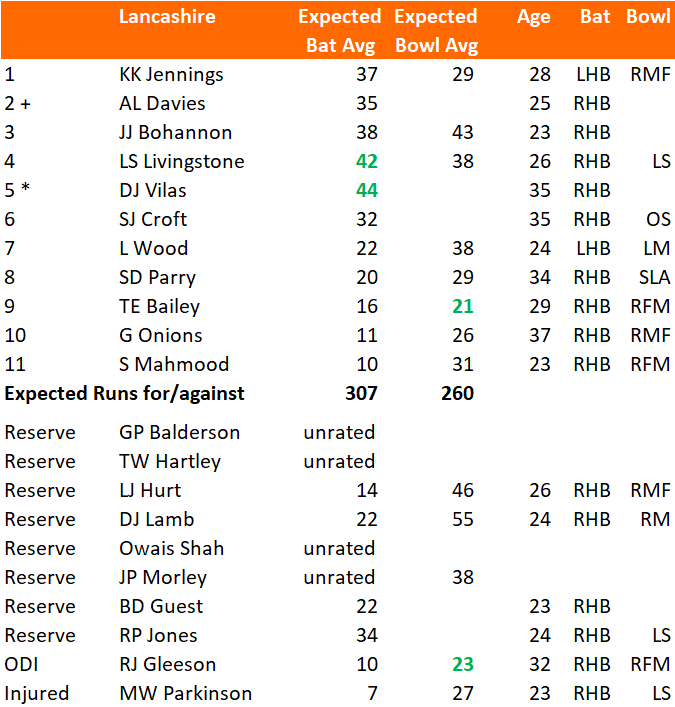
Lancashire (Favourites): Have the bowling to force results. Livingstone, Vilas are two of the best batsmen in county cricket.
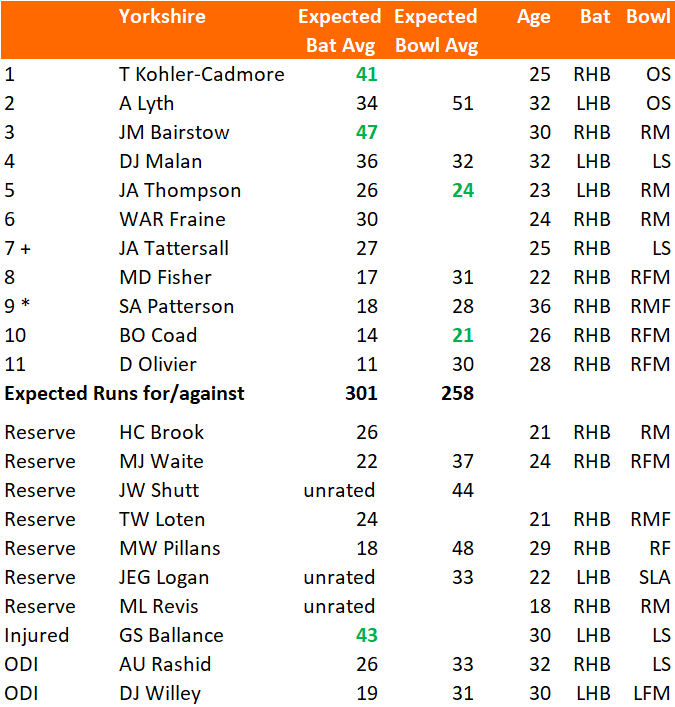
Yorkshire: Challengers, can they win their first game without the ODI players? Will Olivier come to the party? So far he hasn’t shone in the County game. Excellent top order, but will they miss Bresnan’s batting?
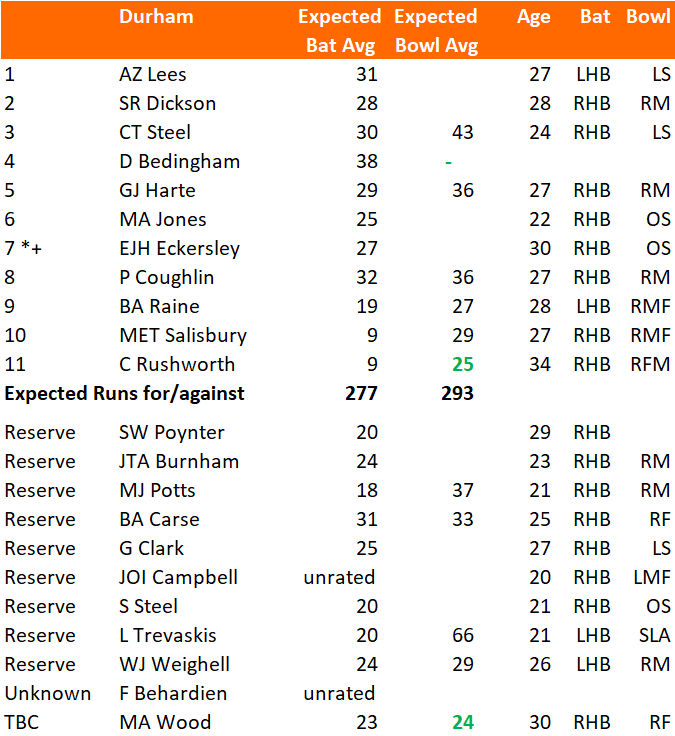
Durham: Raine & Rushworth are an effective pair. Deep batting line up covers the lack of stars. Having four home games helps. I’ve put a couple of pounds on Durham at 33-1 (Ladbrokes), if that sort of thing is of interest to you.
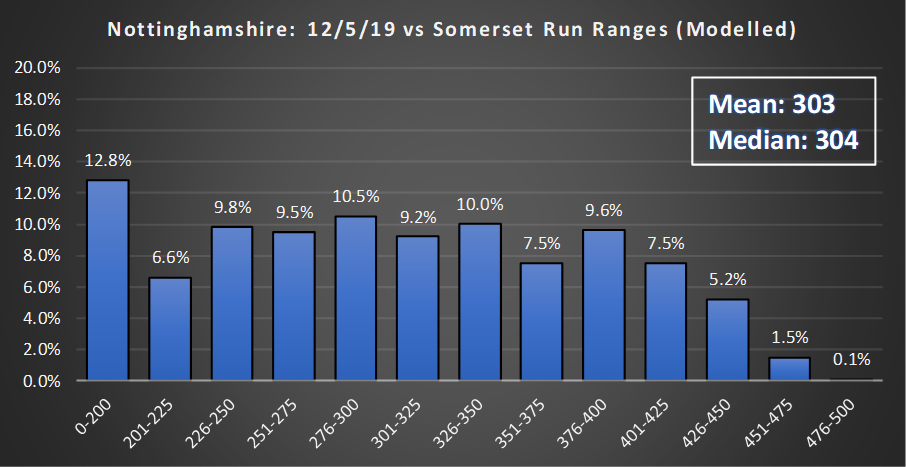
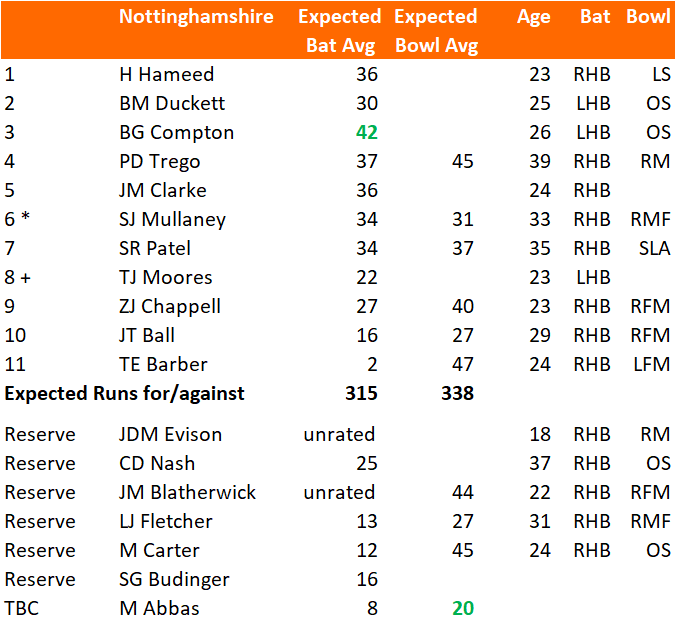
Notts: Best batting in the division: I’m baffled at how that unit struggled so badly last year. Worried about the bowling, especially if Fletcher is out for a while. Ball can’t do it on his own. Mullaney might bowl a lot this year, which is no bad thing.
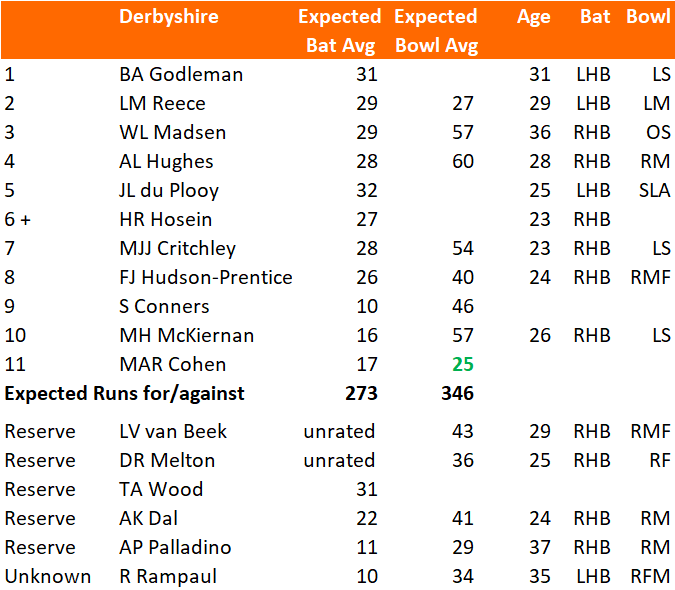
Derbyshire: Hard to see this very raw attack winning the group. Batting’s not too bad mind (Godleman, Reece, du Plooy).
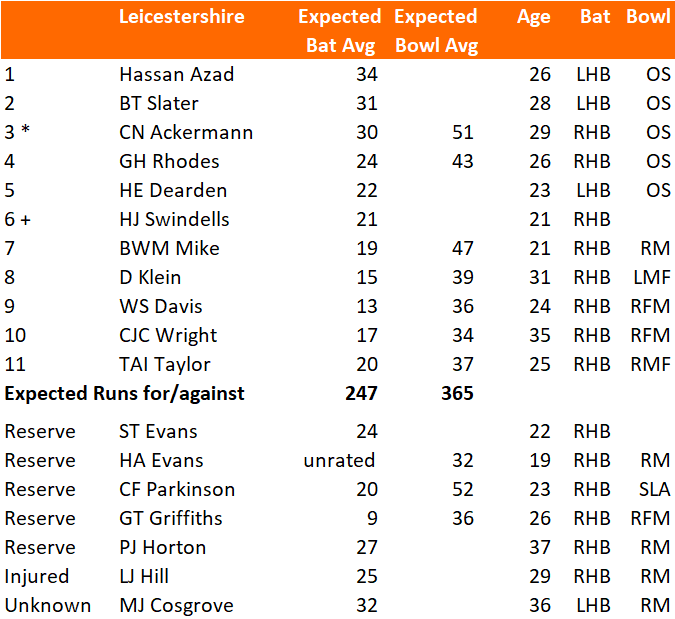
Leicestershire: On paper the weakest team. Maybe one of the younger bowlers will surprise us, otherwise 20 wickets is a tall order. Competitive top three batsmen (Azad, Slater, Ackermann) but not much after that.

The Central Group

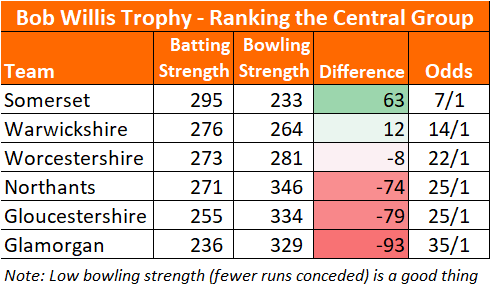
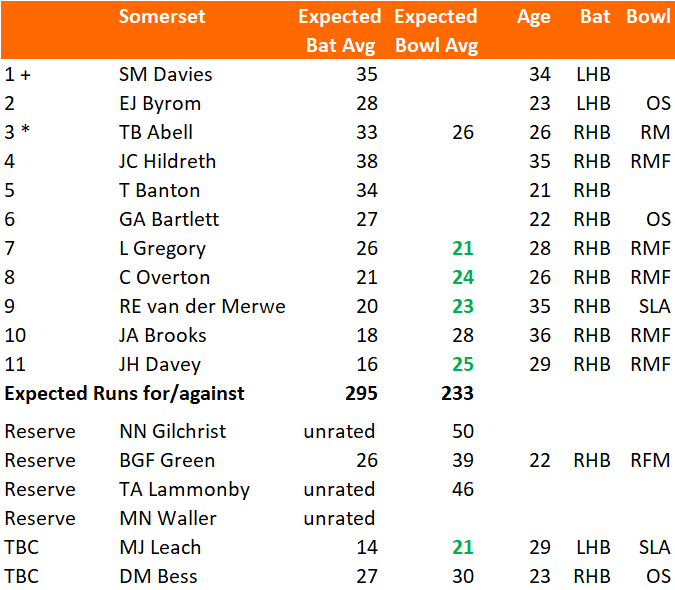
Somerset (Favourites): Best attack of the 18 counties. Should win the weakest division.
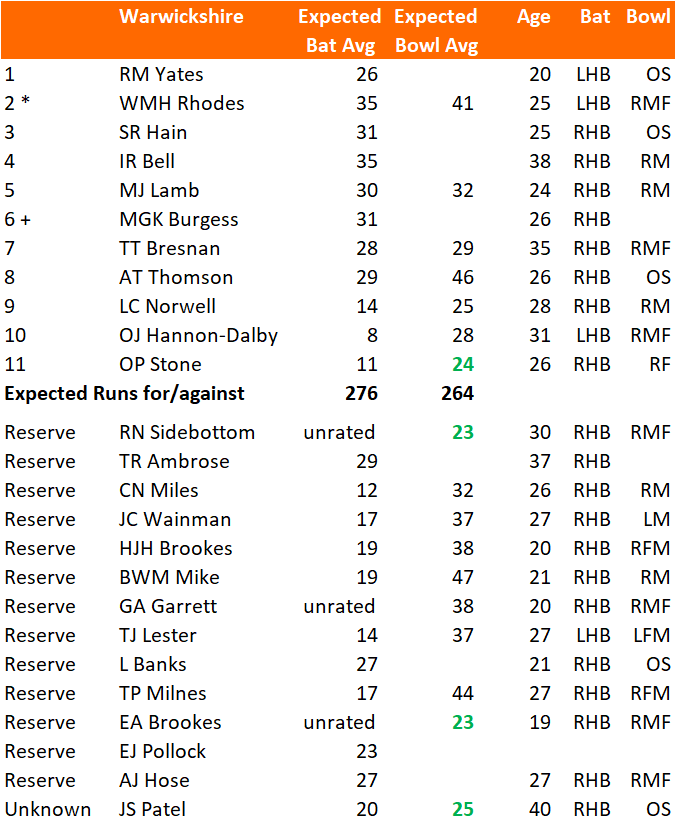
Warwickshire: Will the batsmen let down the bowlers? Much depends on the ageing Bell, Bresnan and Patel. Better reserves than most.
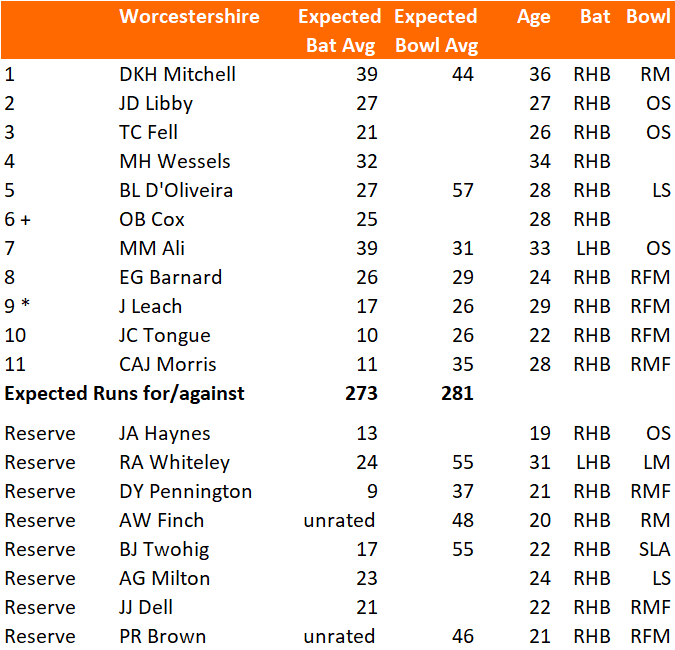
Worcestershire: A couple of batsmen light. Moeen Ali and Ed Barnard are fine all rounders which help balance the side out. Banana skin vs Gloucestershire first up as Worcestershire won’t have Ali (England duty).
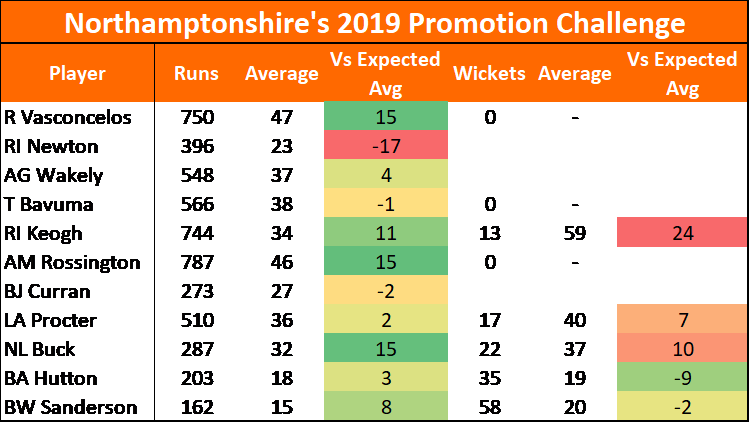
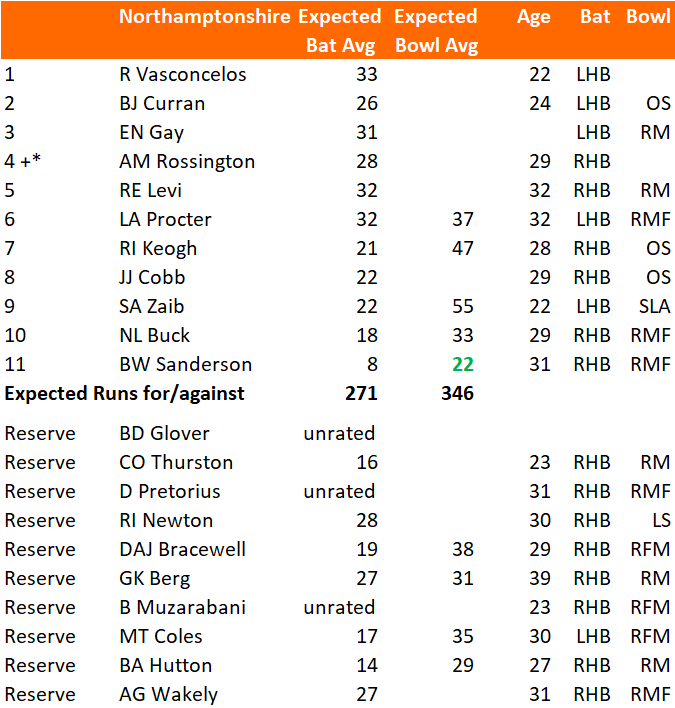
Northants: About three bowlers light. Can Sanderson repeat the magic of 2019 (60 wkts at 20)? If not, “definitely viewing it as a squad competition” might make for some weak teams by late August.
Gloucestershire: This campaign may be an awkward reminder that overseas talent is needed for Gloucestershire to survive in Division 1 next year. Dent and Higgins are clearly talented, but there are stronger squads out there.
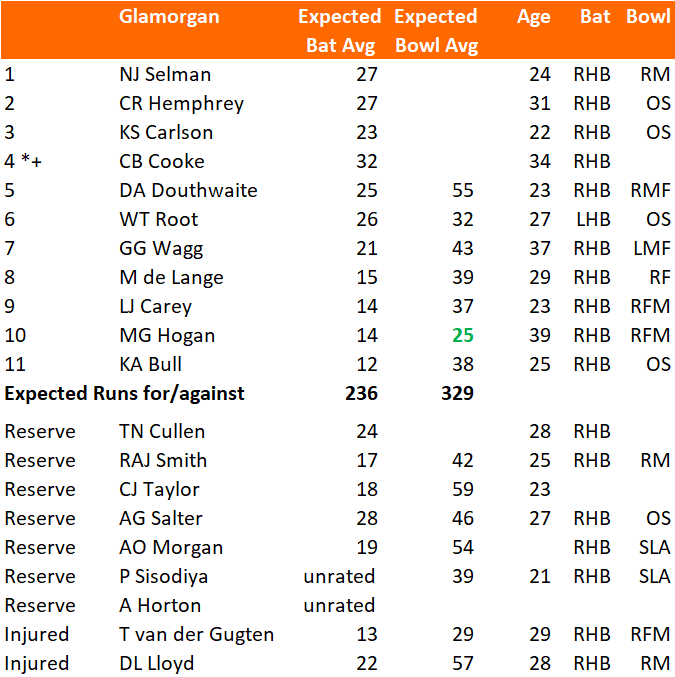
Glamorgan: Cooke will need to deliver for Glamorgan to get enough runs on the board. The injury to Timm van der Gugten is unfortunate – Glamorgan are the weakest attack in the Central Division without him. This year could be valuable experience for the core of a fine future team- Selman (age 24), Carlson (22), Douthwaite (23), Carey (23), Bull (25).

The South Group

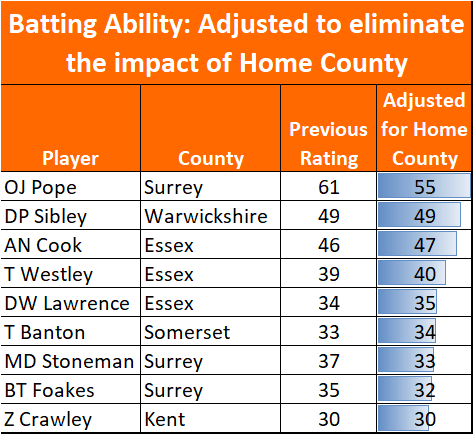
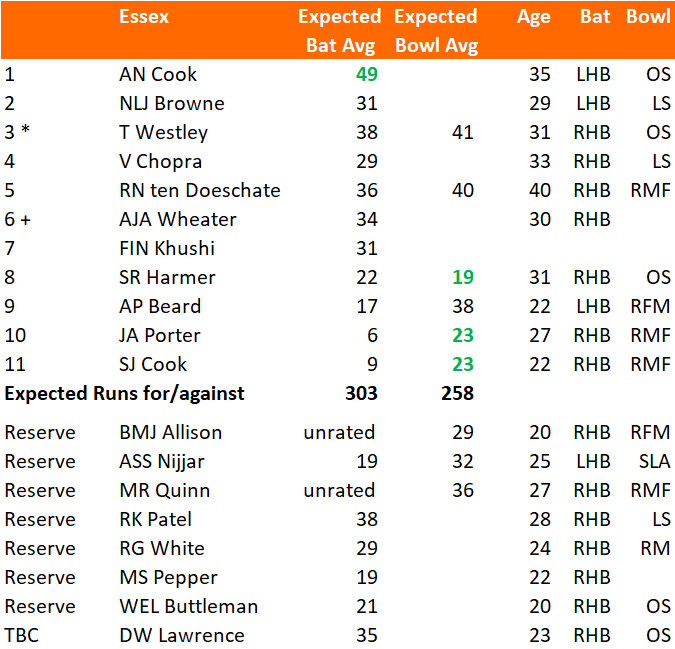
Essex (Favourites) are good. The best team in a tough league. Expect Harmer to deliver with the ball, supported by Porter & Cook. Sir A. N. Cook is the best batsman on show in county cricket.
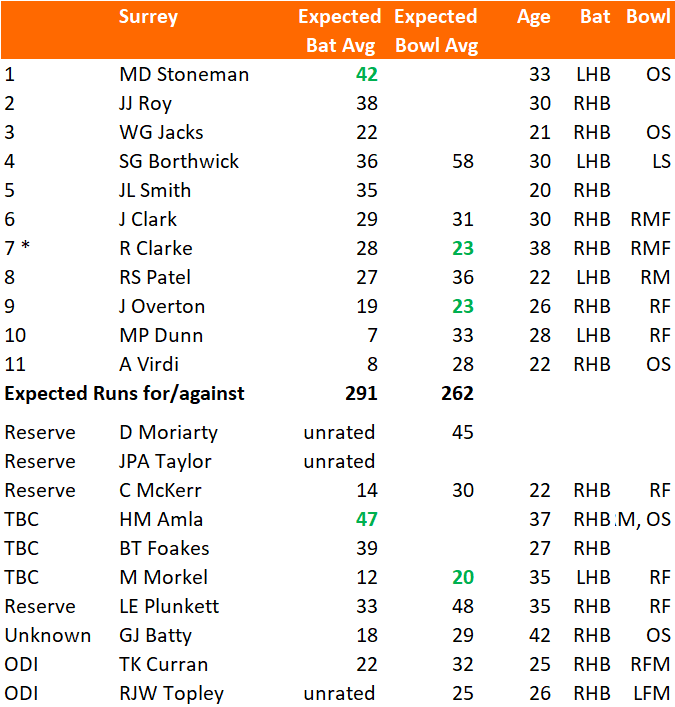
Surrey … Imagine what they could do at full strength. Can hardly blame them if this year is a struggle. Adding Jamie Overton helps, an unexpected development.
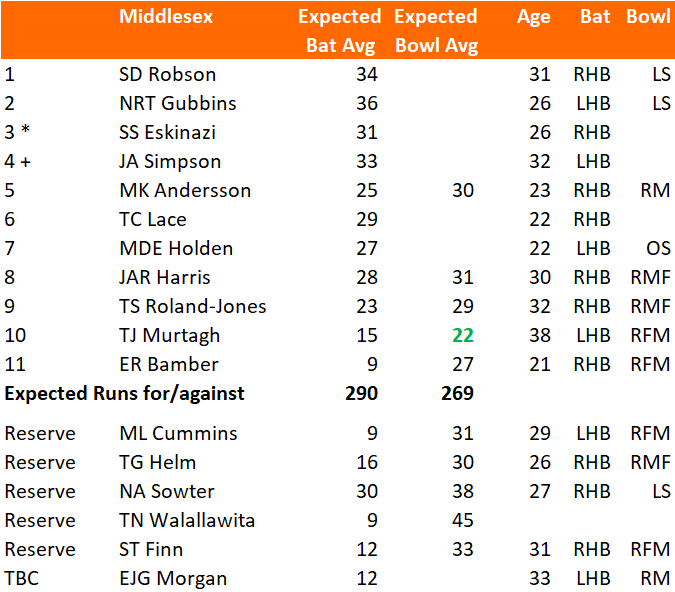
Middlesex are my kind of team – enough batting and bowling to compete, maybe slightly under the radar. Lack of spin options may be exposed in their three away matches, if groundsmen play their cards right.
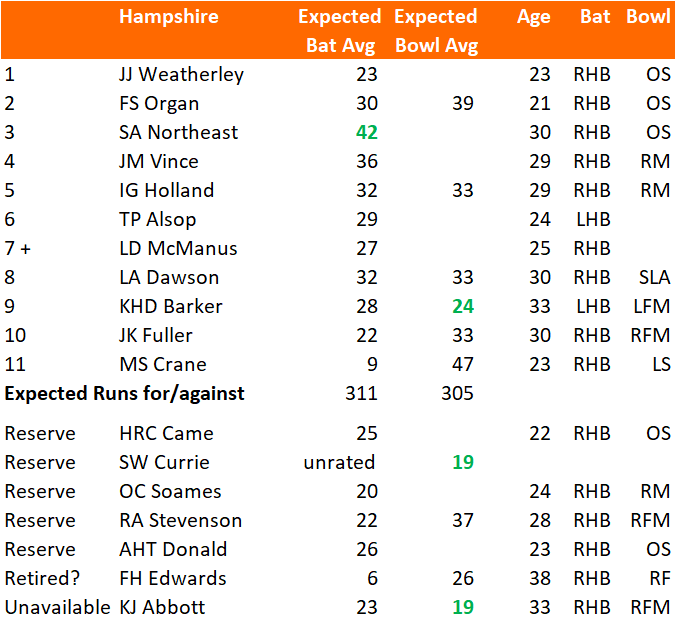
Hampshire: Ditto. No Abbott. No Edwards. Need to get through the games without the ODI players (Vince & Dawson), and see what happens. Mason Crane has an opportunity – there’s lots of right handers out there.
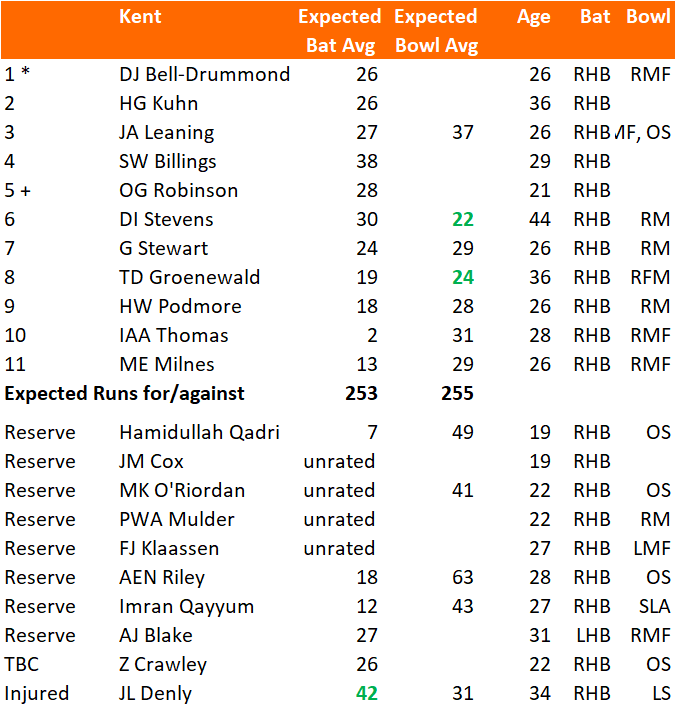
Kent: May do OK against Hampshire and Sussex’s attacks. The other three sides will take some withstanding though. Could do with Denly making an appearance.
Always up against it, Sussex have given a chance to lesser known players this year. A shame. Not sure where Wiese, Wells, Bopara and Beer are. I’ll give anyone sitting this tournament out the benefit of the doubt: I’m not playing cricket in a pandemic, so can’t expect them to.

Anyone can win. Don’t expect it to be the best team – it’s only a five match series. The bookmakers know this – there are 11 teams with more than a five percent chance of winning, yet no team has a greater than fifteen percent chance.

Tomorrow I’ll be following Durham-Yorkshire. A Durham win would make the North group so much more interesting.

Before you go, here are some trends we might see this year:

  • 0fers – there are bowlers that just aren’t ready for this level. They’ll go wicketless, and heap pressure onto captain and opening bowlers. Canny batsmen will get after them.
  • Clusters of wickets – inevitable when the standard is this variable.
  • The league won’t be won by stars – it’ll be won by the deepest batting lineups, and the bowling attacks that never let up. Hence Lancashire, Yorkshire, Somerset, Essex being favoured. Many won’t see it that way – they’ll talk of centuries and five-fors, but it’ll be “Not Collapsing” and “9-2-30-1” wot won it.

Bob Willis Trophy preview: part one

Strange times. This year’s County Championship makes the best of a bad situation by fitting in a five-match group stage across August and September. Here’s what I think will happen, based on the Playing Conditions; disrupted squads; and the weather. Part two of this post will look at which players and teams I expect to do well.

Playing conditions

  • A reduction from a minimum of 96 overs to a minimum of 90 overs in a day’s play.
  • Each county’s first innings of a match can last no longer than 120 overs
  • The follow-on will increase from 150 to 200 runs
  • The new ball will be available after 90 overs rather than 80 overs
  • Eight points for a draw
  • Three regional groups of six. Two group winners with the most points contest the final.

Impacts

Perversely, more draws. Fewer overs per day removes up to 24 overs from a match. Capping an innings at 120 overs limits a team’s ability to go big batting once. Add to that the increased points on offer for a draw, and canny captains (once behind in the match) may change focus to points accumulation. While there is need to win the group and outscore one of the other group winners, a defeat makes qualification very unlikely – so conservative cricket may dominate the first two rounds. The last thing you want to do is give your rivals a 20 point head start.

Mismatches – all 18 counties together for the first time since 1999 gives an opportunity for the stronger players in the second division to prove themselves. However, there is the potential for some mismatches. Gary Ballance against some of the weaker attacks in the North group, for example.

Lopsided groups. The South group is toughest, and thus we are obliged to tag it the “group of death”. Sussex and Middlesex are the second division teams in that group, but are better than that. It will be difficult to win the South group, and the winner may not even qualify for the final if their victories don’t yield sufficient points.

Nothing to play for. After two defeats, a team is almost certainly out of contention. With no relegation, I hope teams do the decent thing and give 100 percent. This will be difficult. “Come on lads, let’s do it for the fans streaming this whilst working from home!” Hopefully something resembling the best possible team is selected, though it would be totally understandable if this weren’t the case: players may have other priorities in a pandemic.

Spinners to the fore. A new ball after 90 overs favours spinners (who will have the ball in their hands more) and lower middle order batsmen (who get easier conditions for longer). Win the toss and bat, surely.

Timing and weather

August / early September matches should slightly favour the bowlers. Last year’s first innings scores were 20 runs lower in August/September than the rest of the season. The Test matches have offered turn, indicating what pitches might do given the dry summer we’ve had.

The long range forecast from the Met Office is understandably vague, though hints at more weather disruption in the north than the south.

Confidence is low, but the second week of August is likely to see a mixture of dry and settled conditions, interspersed with occasional bouts of wetter and windier weather. The majority of the unsettled weather will most likely be in the north and west, though it may spread further south and east from time to time. Temperatures are likely to be around the average for this time of year, with any particularly warm weather being short-lived and generally towards the south or southeast. Looking further ahead into late-August, there are some tentative signs that conditions could become more widely dry and settled, particularly in the southeast.

Availability

These aren’t the county sides you’re used to. No overseas players. No England Test players. Won’t see much of the England white ball crew either. That means ignore the 2019 league positions and look at who will actually be playing. Are Hampshire a credible force without Vince, Dawson, Edwards and Abbott?

This is a great opportunity for the 200-250th best cricketers in England & Wales to get a run of five games. Let’s see how many of them can translate second XI success to First Class.

I’d normally end with a proper conclusion- but without analysing the squads that would be a mistake. Will save that for next time- once the teams announce their squads, I can pull in the ratings from my database to see who is best on paper.

For now- my hunch is that the Central group is the best one to be in. Can’t wait to run the numbers on Gloucestershire, Northamptonshire and Somerset and see who is best placed.

Lower order CC Division 2 runs – are they predictive of Test performance?

Jofra Archer is struggling with the bat in Test cricket, averaging eight and lengthening the tail. Yet he has a First Class average of 26. Is he getting an easy ride batting down the order for Sussex, then being found out at the highest level? Let’s find out.

Recap – Linking Division 2 and Test Batting

Previous workings showed that a played would expect to average 72% as much in Tests as they do in Division 2 (D2). There isn’t that much data though: most Test players are drawn from the top division. Just four players have over 20 completed innings at both levels over the last four years:

Not a bad fit – D2 averages do have reasonable predictive power of Test performance for batsmen (please take note Mo Bobat). You just need to play a decent number of games in both formats.

But what about tail enders in Tests?

Most of the overseas players in D2 are batsmen. There aren’t many bowlers in D2 to have also played Test cricket lately. Here’s the data for the five lower order batsmen to have eight or more completed innings in Tests & D2:

Remember none of these players has 20 completed innings in both formats, so expect volatility. Archer and Mohammad Abbas are the outliers: Archer averaged nearly four times as much in D2, while Abbas has a slightly higher Test average.

Across the five players, their Test average is 63% of their D2 batting average (for all players this figure is 72%).

Tail enders in D2 vs D1

Data is lacking on tail enders in D2 and Tests. Let’s answer a different question. If we are happy with the standard of D1, then all we need to do is demonstrate similar averages for the lower order in D2 and D1, and we can conclude that Jofra Archer is good at batting.

The above chart is for all batsmen that have >15 completed innings in D1 and D2. If anything the trend is for higher averages in D1. Can’t explain that, but at least that gives some comfort that the tail isn’t getting an easier ride in the lower division.

Conclusion

Jofra Archer would be a very unusual player if he continues to average under ten in Tests. I would expect him to average 17 in Tests based on all available red-ball innings. It just happens that the County Championship has seen the best of his batting, and Test cricket the worst.

County grounds ranked by ease of batting

In this piece I’ll look at which grounds are best for red ball batting, and use that to see what impact that has on averages: how much of a boost do Surrey’s batsmen get from playing at the Oval?

Fig 1 – County grounds ranked according to runs per wicket in County Championship matches over the period 2017-19. Grounds where fewer than 100 wickets fell in that time are excluded.

So what?

Beyond it being a spot of trivia, I can immediately see two reasons why this matters.

i. High scoring grounds harm the county’s league position

In County Cricket there are 16 points for a win, 5 for a draw and none for losing. A win and a loss is worth 16 points, while two draws is worth 10. Drawing is bad*.

Fig 2 – Runs per Wicket in the County Championship over 2017-19 plotted against the Draw percentage for that ground. Higher runs per wicket are associated with more draws.

And yet there are teams producing high scoring pitches, boosting the chances of a draw, and reducing their chances of picking up 16 points.

Compare Gloucestershire’s two home grounds since 2017: at Bristol (32 Runs per Wicket), W2 L4 D8. Cheltenham (28 Runs per Wicket), W4 L1 D2. Excluding bonus points, Cheltenham is worth an extra 5.4 points per match. While that’s an extreme example, and the festival only takes place in the summer months, there’s still the question “why make Bristol so good for batting”?

Maybe a deeper look at the data will reveal why Gloucestershire and Surrey don’t try to inject a bit more venom into Bristol and The Oval; for now it looks like an error.

*There’s an exception: a team that is targeting survival in Division 1 might choose to prepare a flat track and harvest batting points plus drawn match points in certain situations. For the other 15 counties, drawing is still bad.

ii. Averages should be adjusted to reflect where people play their Cricket.

When using data to rank county batsmen and bowlers, the one gap that I couldn’t quantify was the impact of how batting or bowling friendly each player’s home county is. With this data we can add an extra level of precision to each player’s ratings.

How would we do that? It would be wrong to simply take the difficulty of a player’s home ground as the adjustment – because there are also away games. The logical approach would be to take the average of that player’s home grounds (50%, weighted by the various home grounds that county uses) and the other teams in that division (50% weighting).

Fig 3 – Impact on batting average from the relative batting friendliness of that county’s grounds (2017-19).

For instance, Olly Pope’s average is artificially inflated by 10% from being based at The Oval. That takes his rating (expected Division 1 average) down to 54.6 from the suspiciously strong 60.7.

Fig 4 – Selected players’ expected averages, now we can adjust for each player’s home county

Equally, Tom Abell clambers up the ranks of 2019’s County batsmen: his rating jumps 7.1% to 35.6 from 33.2. Not an extreme move, but a nice boost to go from 50th to 31st on the list.

This takes us one step closer to a ratings system that captures everything quantifiable. Before next season I’ll adjust the ratings of batsmen and bowlers to reflect this factor.

Further reading

A summary from 2004 of the county grounds and how they play http://www.bookmakers1.com/englishcricketgrounds.html

Remarkable how many of the descriptions feel alien now – you wouldn’t believe that Taunton was “an absolutely stonking batting track”.

Underrated Bowlers – 2019 season

This is my first attempt at something difficult: finding the best players that aren’t regularly playing County Cricket, but that are good enough to do so. In theory there shouldn’t be very many players like this – because counties will know who their best players are.

I’ve used my database of bowling performances from 2016-19 in County Championship and 2nd XI Championship Cricket and picked out six that have promising data.

Time will tell how many of these players get regular first team cricket (and succeed) in 2020.

Fig 1 – Strongest bowlers that played three or fewer County Championship matches in 2019.

I’ve looked at players that have been selected for no more than three County Championship matches in 2019, for reasons other than injury.

Note that England’s Matt Parkinson only played four games for Lancashire in the 2019 County Championship, so might have made it onto a list like this, but he is unlikely to be under anyone’s radar now he’s in the Test squad.

Batting: All County Cricketers Rated

This page contains expected County Championship Division One batting averages for all County Cricketers to have i) played during 2019; and ii) batted in at least 20 completed innings since 2016.

Performances in the Second Eleven Championship, County Championship and Test Cricket are included, though each performance is weighted according to the level being played at (so averaging 30 in Test Cricket is much better than averaging 40 in the Second Eleven Championship).

To give a better indication of current ability, and to partly adjust for age, ratings are weighted more heavily towards recent performances.

Ratings are shown if each player were playing in Division One – this ensures bowlers are compared on an apples-to-apples basis.

This version includes matches up to 29th September 2019. For an update, see the 2021 County Championship preview, which contains much more information about each player.

Top batsmen

Fig 1 – Top 50 Batsman in 2019 County Cricket. Min 40 completed innings since 2016.

Full list

Fig 2 – All Batsmen in 2019 County Cricket. Min 20 completed innings since 2016.

Key findings

Zak Crawley is an odd Test selection

  • Expected Division 1 average under 30
  • Only averaged 34 in 2019, after averaging 32 in Division 2 in 2018.
  • Even separately adjusting for age (he’s only 21), it’s hard to argue he’s currently better than Dent & Rhodes.

Ollie Pope is practically too good to be true

  • Expect his average to come down – he can’t possibly have an expected average exceeding 60.
  • Only 42 completed innings – barely a sufficient sample size to be included in the top 50 players.
  • Still, he’s easily worth a Test place.

Very few English batsmen are capable of consistently averaging over 40 in Division 1

  • Cook, Ballance, Northeast and Brown are the four England qualified batsmen who would be more likely than not to average over 40.

There’s more decent English openers than you may have been told elsewhere

Keaton Jennings, Mark Stoneman, Chris Dent and Will Rhodes could cover Burns and Sibley. And, if he could be coaxed out of Chelmesford, Cook.

England selectors might well be relieved that Cook has retired – imagine having to choose two out of Cook, Sibley and Burns to open the batting.

What do you think?

No doubt there’s plenty of themes and trends from the data that I’ve not mentioned – please do drop me a line through the contact page or @edmundbayliss on Twitter and let me know what you think.

Northamptonshire’s Promotion Drivers

Northamptonshire were at odds of 34-1 to win Division Two before the 2019 season began. They had a lot of work to do to get into the top three.

Things didn’t get any better when Ben Cotton was released after not managing to “reach fitness targets”.

I had them as the sixth best team in early April. Here’s what I said on the twitter:

Not a bad side, but off the pace of the top of Division 2. A batsman light, better balanced with Bavuma replacing Holder on 14 May. A shallow squad – @NorthantsCCC may have to prioritise the competitions where they have the best chance of progressing.

Now they are on the cusp of reaching Division One. Just four points from their game against Gloucestershire will secure promotion. What happened?

1.Batting outperformance

Fig 1 – Northants performance vs expectation, for an XI of the players to have featured in the most matches. Expectations based on 2016-18 red ball data.

Ricardo Vasconcelos, Adam Rossington, Rob Keogh, Nathan Buck all averaged ten or more runs above expectation.

The team as a whole averaged 53 runs per innings more than expected. I think that Rossington, Keogh and Buck had good years, and wouldn’t be expected to repeat that in 2020. Vasconcelos though. 21 years old, already has a First Class average of 37. How good could he be in a few years time?

It’s rare for a team to just have one player underperform with the bat (see the recent Ashes series). 35 batting points is the highest in the league.

2.Hutton

Ben Sanderson was always a candidate to dominate Division Two. His opening partner Brett Hutton has been the surprise package. A career average of 29 pre-summer, yet he picked up 35 wickets at 19.

Sanderson couldn’t do it on his own, Keogh, Procter & Buck bought their wickets at too high a price: without a second top bowler, it’s hard to see how Northants could have picked up five wins.

3.Sussex, Middlesex, Worcestershire

What happened guys? If time allows I’ll have a look at why these teams misfired. They are better than Northants.

What happens next?

If you believe Northamptonshire’s players have made technical changes, and they’ll play at the same level in 2020, then they could do OK in Division One. Maybe Rossington’s captaincy has made a difference.

Personally, I think there will be a lot of pressure on Sanderson, Hutton won’t repeat the heroics of this summer, and Northants won’t win many games next year.

Bowling: All County Cricketers rated

This page contains expected County Championship Division One bowling averages for all County Cricketers to have i) played during 2019; and ii) taken more than 20 wickets since 2016.

Performances in the Second Eleven Championship, County Championship and Test Cricket are included, though each performance is weighted according to the level being played at (so averaging 30 in Test Cricket is much better than averaging 40 in the Second Eleven Championship).

To give a better indication of current ability, and to partly adjust for age, ratings are weighted more heavily towards recent performances.

Ratings are shown if each player were playing in Division One – this ensures bowlers are compared on an apples-to-apples basis.

I’ll update this page periodically, as more games are played and more information is available on each player.

This version includes matches up to 23rd August 2019. For an update, see the 2021 County Championship preview, which contains much more information about each player.

If you’d like to discuss, please feel free to contact me on twitter @edmundbayliss or use the contact page on this site.

Best bowlers:

Full list:

Preview: RLODC 2019 Semi Final 1

Nottinghamshire vs Somerset 12th May 2019

redballdata.com modelling: Nottinghamshire 51% – Somerset 49%

At first glance Notts look unstoppable: W6 L1 NR1, NRR +0.6. Two days of rest and home advantage.

Their batting is excellent: Hales and Duckett over their careers averaging high 30s at a run a ball mean more often than not a solid platform with runs on the board and wickets in hand for Mullaney, Moores, Fletcher to work with at the end of the innings. During the group stages scored over 400 twice in seven innings (Somerset’s highest is 358).

However – Somerset’s strength is their bowling – specifically taking wickets.

This makes for a rather unusual range of first innings scores if Notts bat first. Remember that Trent Bridge is a high scoring ground.

Fig 1: Notts projected runs.

Notts are just as likely to score 201-225 as they are 426-450! Such an even distribution is very rare. Nottinghamshire have a roughly 1500-1 chance of breaking the List A world record of 496.

Compare that to the more steady Somerset. Ali, Hildreth, Abell are dependable but not explosive batsmen. Batting deep means they can dig themselves out of trouble and find their way to a total. Thus Somerset have a 66% chance of scoring in the range 276-375.

Fig 2: Somerset projected runs

These are two evenly matched teams.

If you want an even contest that bubbles up over time, hope that Somerset bat first – they will get a reasonable score. Personally, I’d like to see Notts bat first because *cliche* anything could happen. Yes, I appreciate that means a good chance of a low score that Somerset fly past, or a high score that the visitors will get nowhere near.

The kids aren’t alright

Let’s look at the English First Class matches between Universities (technically the six University Centres of Cricketing Excellence) and Counties. These are vastly mismatched. The 2019 results make depressing reading for fans of university sport: UCCEs played 18 won 0 drawn 11 lost 7. County batsmen averaged 52 runs per wicket, while the students managed a paltry 15. If the UCCEs had been playing in the County Championship, they would have picked up a mere four batting points in over a season’s worth of matches.

It’s quite telling that over the last three years, only three student bowlers came out averaging under 35.

Fig 1- UCCE bowling performances against Counties in First Class Cricket, 2017-19. Overall bowling figures aggregated by player

Let’s not beat about the bush – the Universities were hazed by Counties that weren’t even at full strength. At first glance you might conclude that we can’t learn anything from these matches. Don’t be so defeatist! We have an opportunity to test how much better batsmen become when competing against players from a couple of rungs down the sporting ladder. It has always puzzled me: what should I model when an average player faces great bowling?

The method I’ve used is to compare individual batsmen’s performances in University matches against expected performance in County Championship Division 1. Since there aren’t that many University matches, we’ll need to group players by expected average to get meaningful sample sizes. We will also use three years’ worth of matches.

For the expected averages of each County batsman I’ve already done the legwork- see https://twitter.com/EdmundBayliss/status/1112335412658401280 and https://twitter.com/EdmundBayliss/status/1108509473591775233.

Here are the results:

Fig 2. The orange line represents the expected averages for each group of players (eg. “Very Low” are players who average below 20). The blue line shows the average vs Universities for that cohort, while the Grey bar (right hand scale) shows the ratio between actual and expected average.

Some interesting findings:

  • Overall “multiplier” (ie. boost to batsman’s average from facing University level bowling) 1.73 – a batsman who averages 30 in D1 would average 52 against UCCEs.
  • The University matches can distort First Class averages, especially for players with limited Caps. For instance, George Hankins averages 25 in FC Cricket, but strip out University matches and that drops to 23. Ateeq Javid’s 25 also drops to 23 when you exclude the 143 against Loughborough. Thus “First Class” average is reliable for county regulars, but fringe players will play a higher proportion of their innings against students. In these cases, “First Class” average should be disregarded in favour of a blended measure of County Championship & Second XI matches.
  • Batsmen with the lowest averages get the biggest boost– this could be because County Cricket pits them against deliveries which they aren’t good enough to defend. Put them against easier bowling and their technique is up to it, so they flourish.
  • Both the “Good” batsmen (who average 30-40 in D1) and the “Very Good” batsmen become excellent averaging 60+ against Universities. Why the plateau at 60? This is possibly caused by batsmen that “Retire Out”– which will affect the highest scoring (ie. best) players more. The concept of “Retired Out” is another reason UCCE matches distort FC averages.
  • Players ranked “Good” or above scored 29 hundreds in 131 completed innings. That’s a Century every 4.5 innings. Quite a mismatch between bat and ball.
  • It’s hard to appraise fringe County players, because of the low number of matches played. Ideally, scores from the University matches could be incorporated into my database in the same way 2nd XI matches have been (by adjusting for the difficulty of the opposition). However, the above tells us that the standard is too low and variable – so disregarding the data is the safest approach. This means that raw First Class averages are potentially suspect, and county selection should not be based on performances against the Universities – no matter how tempting it is. A fine example of selection being driven by University matches is Eddie Byrom being picked by Somerset on the back of 115* against Cardiff UCCE. He made 6 & 14 against Kent, and hasn’t played since.

Conclusion

Based on the above, there’s no evidence to say that top batsmen become impossible to get out when they play against weaker bowlers. A reasonable approximation is that Division 1 batsmen would average 72% more when playing against Universities.

When modelling expected average for a given batsman and bowler, the following rule of thumb is sufficient: Expected average = (batsman average / mean batsman average) * (mean bowler average / bowler average).

PS. Fitting the University Matches into the English summer

What place do the UCCE matches have in the cricketing calendar? Tradition is important. Personally, I would like these matches to continue. What’s needed is a window where the best players are unavailable (as these matches are of limited use to them).

In their wisdom, the ECB have established a 38 day window called “the Hundred”. I propose a change to the calendar – instead of the University matches, the 50 over competition should be the curtain raiser for summer. Half the group games could take place in early April, with the other half happening at the start of “the Hundred” window. This would be followed by two weeks of UCCE matches.

This would ease some of the congestion in the fixture calendar, and make a more logical use of county squads and grounds while we wait for “the Hundred” to finish. It would also mean full strength squads playing some 50 over Cricket, so England have some chance of being competitive in future World Cups.