Recovery time in One Day Cricket: quick turnarounds punish bowlers

Cricket is a batsman’s game. Whether or not that’s true, we can add another pillar to that argument: 50 over matches two days apart hit the bowlers harder than the batsman.

The last iteration of the Royal London One Day Cup took place this summer. At the time, I had a look at how fatigue impacted players, and included a stat that the “Batting Team being better rested yielded an extra 0.23 runs per over”. Re-reading that piece, it became apparent that I hadn’t shown my workings. Let’s put that right: I’ll not only demonstrate the impact, but also quantify how much is that is down to bowler vs fielder fatigue.

Step One: Demonstrate that 48 hours between matches impact performance in the field.

Taking all bowling spells from the One Day Cup, I filtered on just the bowlers who bowled more than 25 overs in the tournament and looked at how they performed in each spell relative to their tournament Economy Rate.

Bowlers (and the fielding team)

Fig 1: Economy rate impact vs number of days between matches (ie. playing on the first and third of May would be two days between games).

Pretty clear trend here – if a bowler played two days beforehand, their Economy rate would be 0.16+0.06 = 0.22 runs per over higher than if they had three days between games. There’s a decent sample of 863 overs for the 3 days’ rest bucket, so the data should be reliable.

There’s also some evidence that an extra day improves Economy rate even further.

Batsmen

Fig 2 – As for Fig 1, but varying rest times for the Batting team

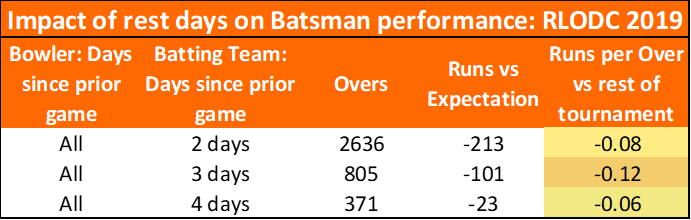
No clear trend here. 0.02 runs per over is one run per match, so whatever the impact here it’s not big.

Step Two: Demonstrate the impact is partly bowler and partly fielder fatigue.

We’ll start with an assumption: spinners can bowl 10 overs repeatedly without getting tired. Admittedly, the last time I bowled 18 overs in a day I tore my groin, but for professional sportsmen I think that assumption is OK.

Now we’ll break down the 2/3/4 day rest views for bowlers by the type of bowler and see how the impact varies.

Fig 3 – Relative Economy rate impacts from fatigue for Pace vs Spin bowlers.

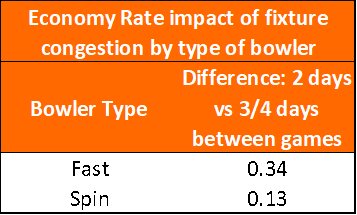
If the spinner isn’t tired, why is he going for more runs when there’s two days between games? I think it’s because his fielders are a little ragged. The odd one becomes a two, occasionally the fielder can’t quite cut the ball off.

Interpreting the table above, playing games two days apart costs 0.13 runs per over * 50 overs = 6.5 runs due to fielder fatigue plus an extra 0.21 runs for every over a fast bowler delivers.

Discussion

  • When should a fast bowler be rested? I’d say it’s at the point when an inferior player would be expected to perform better. I came to that conclusion after reading this piece in the Daily Telegraph about Australia’s squad rotation in the Ashes. Why were Australia only rotating their weaker bowlers? Because the best bowlers, even tired, were still better than the alternative. Hazlewood is irreplaceable.
  • This analysis could be easily extended for 20-20. I’d expect a smaller effect for the shortest form of the game as each game takes half as long. Other factors to consider for 20-20 might be number of games played in the last 10 days, or the number of days travelling (a run of home games is probably less tiring than a week on the bus).

Appendix

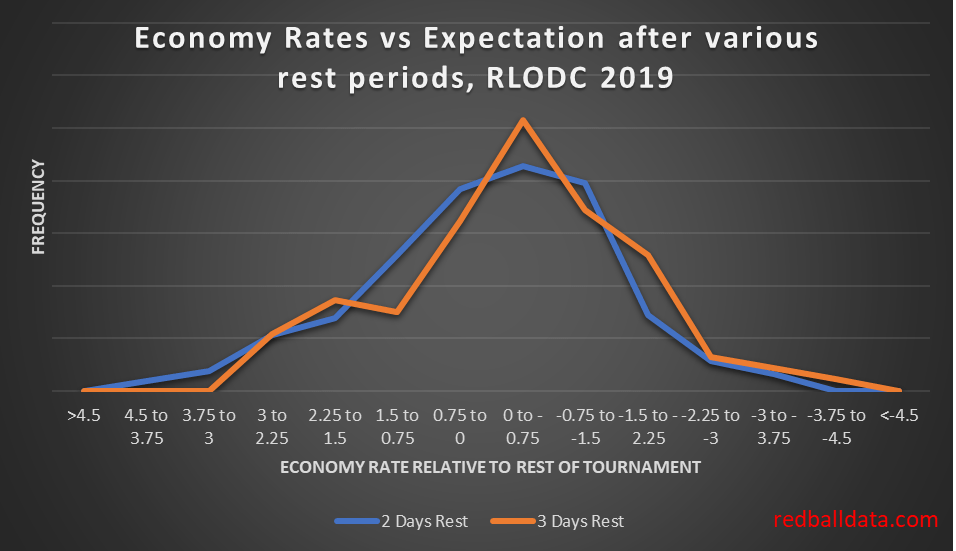
The following chart is ugly, but I just couldn’t exclude it completely – it shows that when tired, more bowlers go for a bit more than expected, and fewer go for a bit less than expected. Can’t really construct a narrative around that, though it helped persuade me that I wasn’t just inventing patterns from the data and the effect of fatigue is real.

Fig 4 – frequencies for individual player match economy rates vs their average economy rate in the 2019 Royal London One Day Cup. Minimum 25 overs bowled.

Preview: RLODC 2019 Semi Final 1

Nottinghamshire vs Somerset 12th May 2019

redballdata.com modelling: Nottinghamshire 51% – Somerset 49%

At first glance Notts look unstoppable: W6 L1 NR1, NRR +0.6. Two days of rest and home advantage.

Their batting is excellent: Hales and Duckett over their careers averaging high 30s at a run a ball mean more often than not a solid platform with runs on the board and wickets in hand for Mullaney, Moores, Fletcher to work with at the end of the innings. During the group stages scored over 400 twice in seven innings (Somerset’s highest is 358).

However – Somerset’s strength is their bowling – specifically taking wickets.

This makes for a rather unusual range of first innings scores if Notts bat first. Remember that Trent Bridge is a high scoring ground.

Fig 1: Notts projected runs.

Notts are just as likely to score 201-225 as they are 426-450! Such an even distribution is very rare. Nottinghamshire have a roughly 1500-1 chance of breaking the List A world record of 496.

Compare that to the more steady Somerset. Ali, Hildreth, Abell are dependable but not explosive batsmen. Batting deep means they can dig themselves out of trouble and find their way to a total. Thus Somerset have a 66% chance of scoring in the range 276-375.

Fig 2: Somerset projected runs

These are two evenly matched teams.

If you want an even contest that bubbles up over time, hope that Somerset bat first – they will get a reasonable score. Personally, I’d like to see Notts bat first because *cliche* anything could happen. Yes, I appreciate that means a good chance of a low score that Somerset fly past, or a high score that the visitors will get nowhere near.

“Royal London One Day Cup – Group Stage Review” or “Notts and Hants FTW”

If imitation is the sincerest form of flattery, I have something of a crush on International Cricket Captain. Much of the modelling I’ve done is an attempt to recreate what that game could do in simulating whole matches in the blink of an eye. Here is a link to the International Cricket Captain website, if you think you might have 300 hours to kill this summer.

There are two parts of the International Cricket Captain engine I’ve not incorporated: Form and Fatigue. I don’t believe in form and won’t incorporate it until it shows up in the numbers (if the facts change, I’ll change my mind). Let’s look at fatigue instead…

Background

Fixture congestion is nothing new – who can forget 1066, when Harold II’s middle order collapsed at Sussex just 19 days after an attritional fixture on a Yorkshire out-ground.

The Royal London One Day Cup (RLODC) has a punishing schedule – most matches are played less than 48 hours after the last one finished. Some teams get longer breaks- which means we have tired players against slightly less tired ones. This gives us some tasty data to measure the impact of fatigue.

Before we get into the numbers, I’d like to define the tiredness in question – it’s mid-week weariness. Not the short term fatigue that means that as a bowler goes through a spell their effectiveness drops, nor the possibility of long term decline over a season from a relentless schedule. This tiredness is like the mid-music-festival malaise one might experience on the Saturday of Glastonbury, when the preceding days take their toll.

To define a “fatigue factor” we need to see how players fare when one team has had more rest than the other.

Findings

Factors affecting RLODC Team Performance

  • Home Advantage: Home team gains 0.13 runs per over. Away team loses 0.13 runs per over. Net effect on a match 13 runs. I wasn’t specifically looking for this, but had to analyse it as a factor that needed to be controlled for before conclude on Fatigue.
  • Fatigue: Batting team better rested gains 0.23 runs per over. More rested Bowlers concede 0.23 fewer runs per over. Maximum impact on a match 23 runs.

Implications i. 2019 RLODC

Fatigue has an interesting effect on the semi finals: the winners of the North and South groups host the winners of quarter finals between the teams which finished second and third in the groups. The quarter finals take place on the 10th May 2019, the semi finals on the 12th May 2019.

Nottinghamshire and Hampshire have been the best teams in the group stage, and will have both home advantage and the benefit of >6 days rest, rather than the two days of rest the quarter finalists have.

I will running these extra inputs through my 50 over model this weekend to see if this insight offers any gambling opportunities. My expectation is that I’m late to the party on this, and the odds will already factor in rest periods and home advantage.

Implications ii. Selection

In a tournament like the RLODC, we should see more rotation of bowlers in and out of the team, particularly if a squad has bowling depth. Sussex only used eight bowlers in as many matches: who knows whether giving Hamza a day off might have been the difference that got them into the quarter finals, instead of mid-table disappointment. Just imagine if Sussex had had Chris Jordan available to them for the second half of the group stages, rather than on England duty.

Further Reading

Green All Over – Betting Blog, see link for a post on the impact of rest on Baseball odds (which reminded me that there was a potential input I was ignoring).