County bowlers may start to show signs of fatigue this third week of the season. I’ve previously heard the response that it wasn’t a problem for bowlers in the good old days.
And if that’s true, then fair enough – either 1) my hypothesis is wrong (that elite pace bowlers can’t play four-days-on-three-days-off without a decline in performance) or 2) the old days were easier, meaning players could trundle all season long with no drop in performance.*
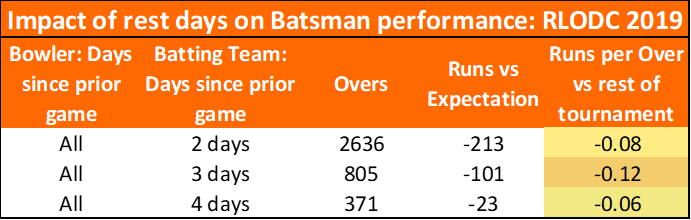
So I had a look at Fred Trueman’s record. Before we get into the results, it’s worth reminding ourselves of how the County Championship used to work. To modern eyes it looks relentless. Most games started the day after the last one. That meant August 1962 had nine three-day county fixtures, the only respite being Sundays (mid-game) where there was no play.** That is phenomenal fixture congestion. Did it impact performance? Yes.
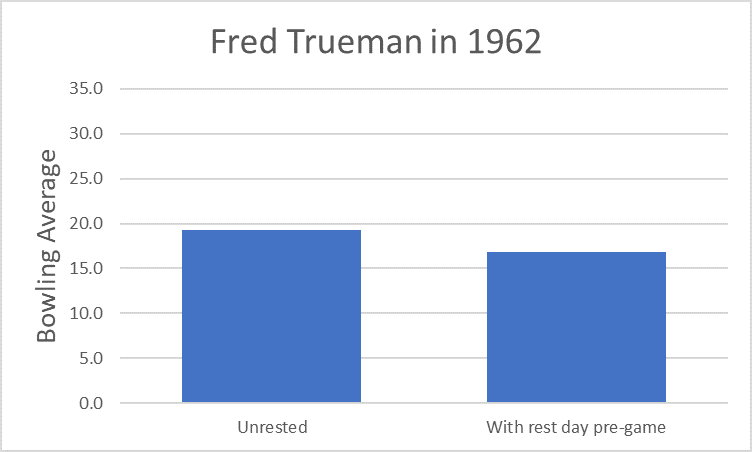
Fred Trueman bowled 802 overs in the 1962 County Championship. Was he aware he averaged 15% more when one game started the day after the previous one? Rising to 23% if you just look at the County games.
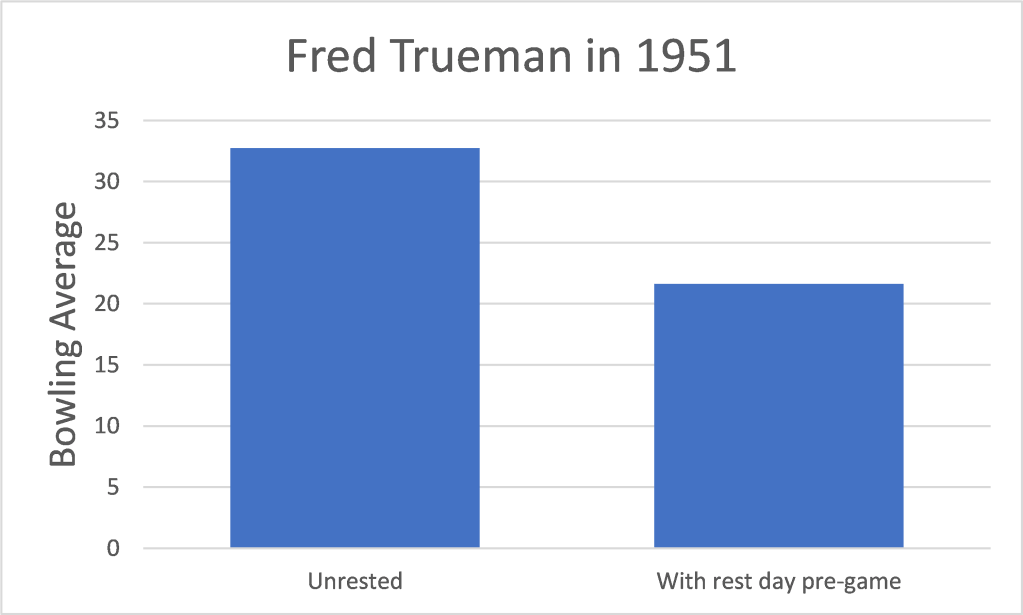
The outcome was confounded by Trueman playing four Tests over the summer, so I looked further back – to the summer before he became an international cricketer, 1951. There the gap really was stark – averaging 51% more if there was no gap between games.
In the 15 matches where Trueman was unrested, he went wicketless in five of them. That didn’t happen in any of the ten games where he was coming in off at least a one day break.
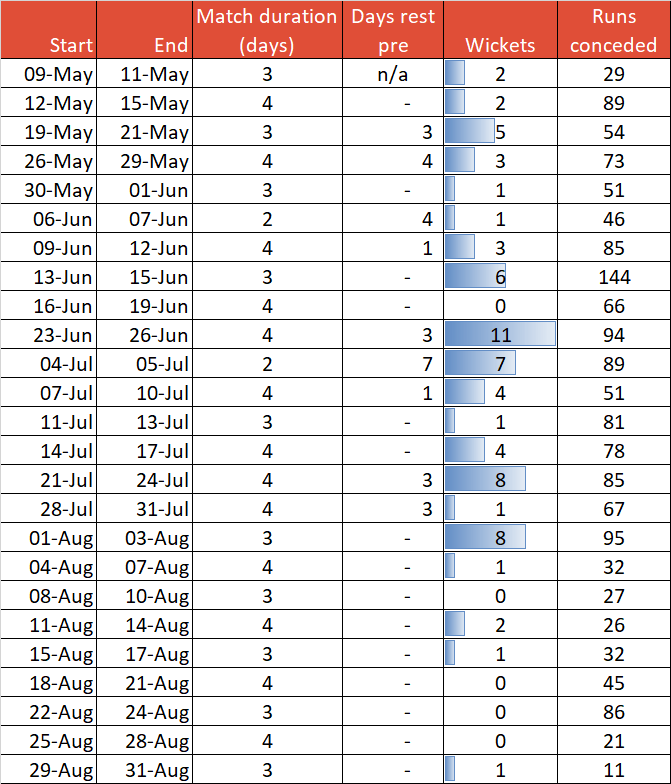
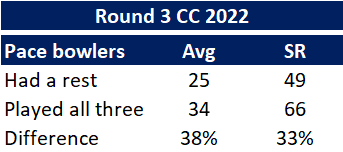
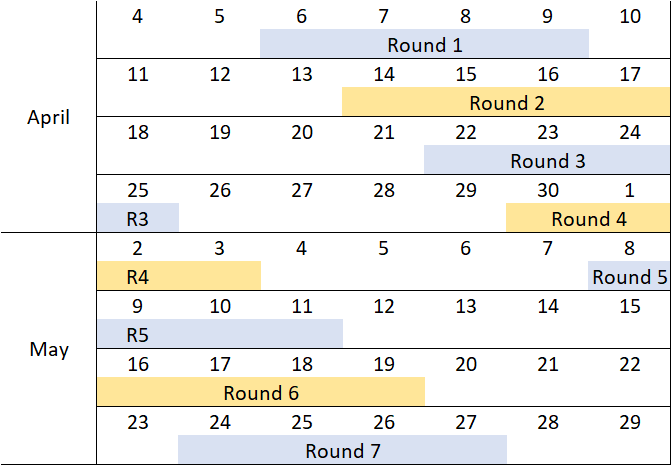
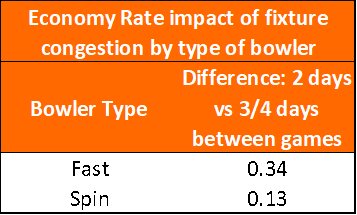
In next week’s county games look at the pace bowlers with the heaviest workloads already this season: they’ll collectively be off their best. That’s Durham, Kent, Gloucestershire and Middlesex.
PS. I think there are three things bookmakers miss when compiling county odds: Fatigue, Home Advantage, and the benefit from fielding first. So far, I’ve be unable to exploit this. At least there are 13 game weeks to go…
*There’s a third option – that players used to be tougher. And a fourth – that the warm-ups and drills make modern games more tiring than they need to be. I choose to discount these, but make your own mind up.
**I’m just about old enough to remember when some Tests had a break on a Sunday. Feels like another world.