Test probability: India 62%, England 24% Draw 12%.
Series probability: India 72%, England 11%, Draw 17%. India are more likely to win 4-0 than England are to win the series.
Or at least that’s what my model thinks. Betting markets have England as low as 18% for the first Test. That’s reflecting low expectations of England’s batsmen against spin, and higher home advantage that my reckoning.
Hereafter are some notes that inform my thinking:
Country – Spin takes 60% of wickets in India. For England, that means Root will probably bowl a bit to support Leach and Bess. However, since 2011 overseas spinners average 43 in India, for the hosts that figure is 25. India seems a tough place to crack.
Grounds – Chennai has only had two Tests since 2011, Ahmedabad has been rebuilt since it last hosted a Test. So not as much to go on as usual. What I can tell you is that in the last seven FC games at Chennai only twice has a team gone past 350. If I’m awake, it’ll be interesting to see how the wicket plays (and how CricViz rate the batting conditions).
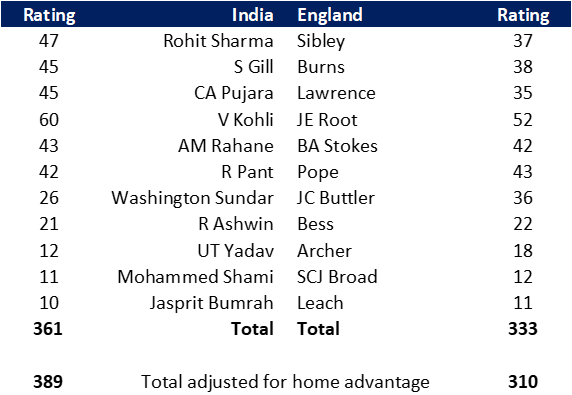
Batting Talent – India are 10% stronger than England. Add 15% home advantage that becomes 25%.
Bowling Talent – adds a further 9% advantage to India. There’s no area of the game where England are stronger than India in India. That doesn’t mean they can’t win, it would just be an upset.
Matchups –
India’s current lineup are really good against spin (Pujara averages 76, Kohli 71). England’s batsmen mostly have better stats against pace. Ashwin averages more batting against the twirlymen than Ben Stokes. Bairstow’s skills in this area will be missed (1,685 at 46). England may need someone to Make Things Happen with the old ball.
Ravi Jadeja is injured. Thus England’s right handers benefit from facing two off spinners (Ashwin and Sundar). Ashwin averages 31 against RHB (SR 60), 20 against LHB. So while England’s right handers might have a good series, expect to see Ashwin into the attack early when Stokes comes to the crease, and if Burns starts well.
Format – back-to-back Tests at Chennai, and back-to-back Tests at Ahmedabad. One silver lining for England is that Anderson and Stone can rotate in for Broad and Archer. Bumrah is harder to replace. England may benefit from the 7% increase in a bowler’s average playing back-to-back Tests.
Home advantage – 15% (lower than the usual 21%, might flatter England as they won in 2012 with peak Swann and Panesar, which distorts the stats). Maybe I’m being generous to England putting 15% into the model.
Here’s some brief notes written ahead of the first Test. I really should have put this up before the Test started. Anyway:
I give England only a 31% chance in the first Test. The betting markets say 39%. Why the difference? The toss is vital and England’s batting isn’t at full strength.
Batting first is key. SL are W7 L1 D1 batting first, W3 L4 D0 batting second recently. Batting first is worth 148 runs (runs per wicket by innings over the last 10 years: 40, 28, 29, 26). A 400 pitch becomes a 280 one after the successful tossers have had their fun with it.
Note spin is no good in first innings (average 42, SR 77). If you field first and get nowhere in 20 overs, you are in very deep trouble.
England have a lot of right handers. A tasty matchup for a leg spinner or SLA bowler. There are two in the Sri Lanka squad: Lasith Embuldeniya averages five wickets per FC game, PWH de Silva is more an all rounder who averages two per game. Embuldeniya averages 40 after seven Tests, but with a FC average of 25 in Sri Lankan conditions, he has a great opportunity. Surprised to see Embuldeniya’s odds 25-1 for Man of the Match. Oh, and he’s Sri Lanka’s leading wicket taker over the last two years.
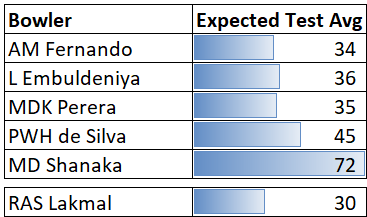
On the topic of Sri Lankan FC averages, there’s a gulf between Test Cricket and the Sri Lanka Premier League Tier A. It’s hard to estimate because there are few (if any) overseas players for calibration, but I make the increase in bowling average 70%: a 25 average in Tier A translates to a Test average of 43. Here’s the expected averages for Sri Lanka’s attack:
Expected averages for Sri Lanka’s attack. Lakmal will be missed in the first Test. Fernando looks useful.
Away teams pick too many spinners (over the last ten years away spinners average 35 at Galle) likely because teams pick more spinners than are Test standard. The relevant decision is “who will do better, our third spinner or our first change pace bowler”?
In England’s case they that’s not a question of spinning ability, more the balance of the side. With Ali unavailable, England don’t have the batting depth to pick a third specialist spinner. Expect Curran+Bess+Leach+Two Pacers+Root. Sri Lanka will know this, so have an incentive to prepare a spinning pitch and nullify England’s pace attack. Unclear what the pitch will be like as has to be good enough to take back-to-back Tests.
Curran and Bess may not offer enough in either batting or bowling to balance the team. Maybe in a couple of years, but today England look beatable.
Put all that together, England have the better bowlers, but the toss is so important that it’s a great leveller. Win the toss, bat, win the game.
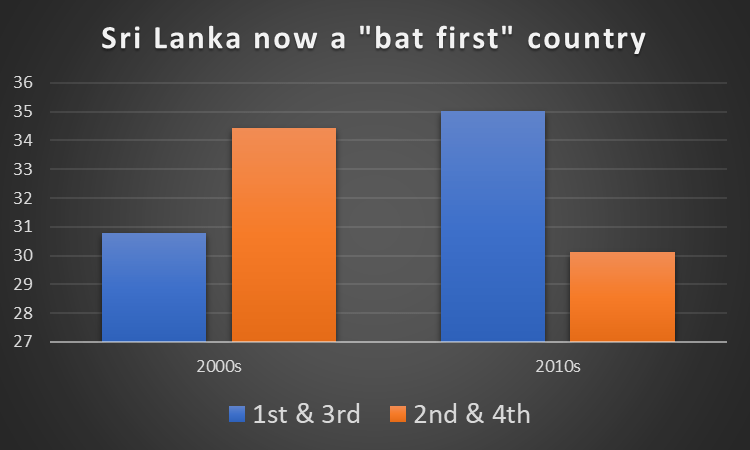
Changing conditions
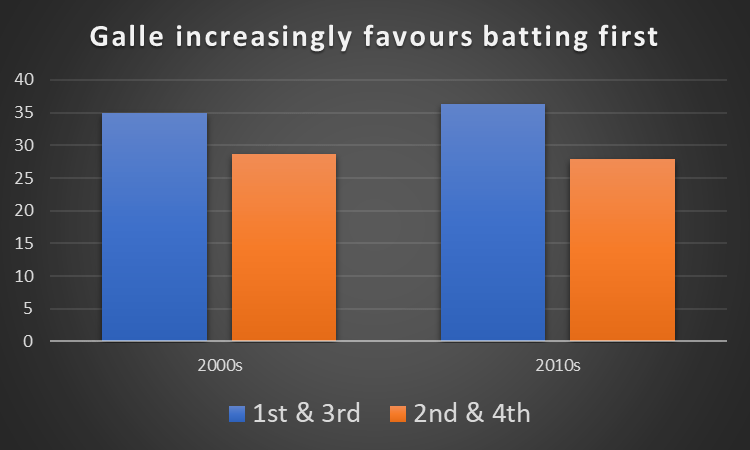
I hadn’t noticed this change – it used to be that the 2nd innings was the time to bat in Sri Lanka. Now it’s the 1st innings. See below the difference in runs per wicket from batting first/third versus second/fourth. A big advantage to winning the toss and batting.
Why should that change happen? Different groundsmen? Different grass? Playing at a different time of year? Either way it shows the importance of “live” queries feeding models rather than fixed assumptions.
PS. Reflecting after the first day’s play I need to think about specific matchups. Bairstow and Root are good against spin, even when it turns away from them.
PPS. There’s a lot of Test series happening right now – will December/January become the annual window of international red ball cricket?
PPPS. The comments about the importance of the toss look silly when spin took 6-85 in the first innings. Was I wrong or were Sri Lanka’s batsmen wrong? Hard to gauge without xW data.
It’s naive to assume that England will play as well in Mohali as they do in Melbourne.
But how to measure this? Results are misleading: a 20 run win is not as dominant as a 220 run one. Hence runs per wicket (RPW) is the best approach.
We should adjust for the relative strength of teams: Bangladesh have lost all four games in England this century – but is that purely because of the gulf in talent? If Bangladesh were as good as England, how much would they lose expect to lose by because they were playing in English conditions?
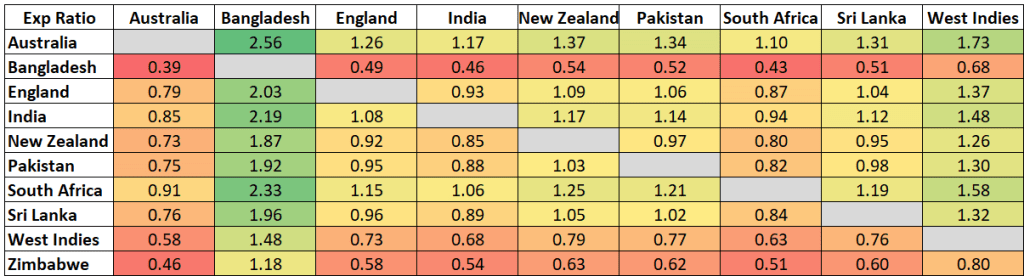
Here’s my approach: use all data since 2000 to calculate the number of runs per wicket scored by each team, and the equivalent conceded when fielding. Comparing runs per wicket when fielding to the average team gives a measure of each team’s bowling strength (eg. India’s 32 makes them 3% better than the average fielding team). New Zealand average 31 runs per wicket batting, so we would expect New Zealand to score 31 * 0.97 = 30.1 runs per wicket when playing India.
Repeating that for every pair of teams gives a set of ratios of relative strength:
Relative team strengths 2000-2020 based on runs per wicket batting and bowling. eg. Australia would expect to outscore England by 26% in a Test on neutral territory.
See where we’re going with this? Now all we need to do is compare actual relative runs per wicket when the countries play each other to get specific country vs country matchups.
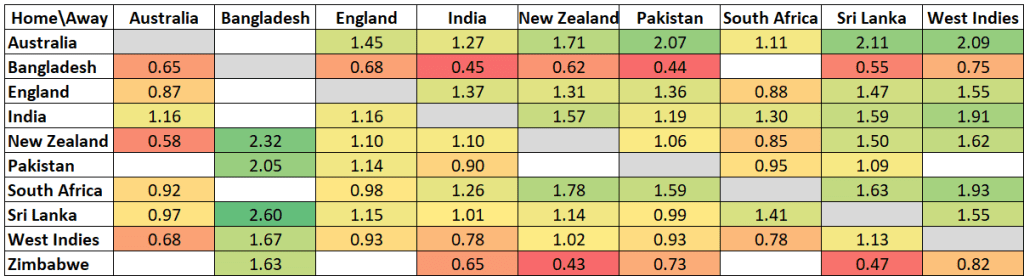
Here are the actual RPW ratios when the home team (first column) plays a specific away team (first row):
Actual RPW ratios 2000-2020. For example, Australia outscored England by 45% when at home, while England were outscored by 13% when hosting Australia. Minimum 50 wickets – blanks reflect a lack of data.
Let’s take stock. When Australia host West Indies they’ve dominated them – scoring 2.09 runs for every run scored by West Indies. Most of this can be explained by Australia being 73% better than West Indies. The remainder is from conditions and player-on-player matchups. Even if West Indies were able to field a team as strong as Australia, they would still be outscored by 2.09 / 1.73 = 1.21 times (or 21%) playing in Australia.
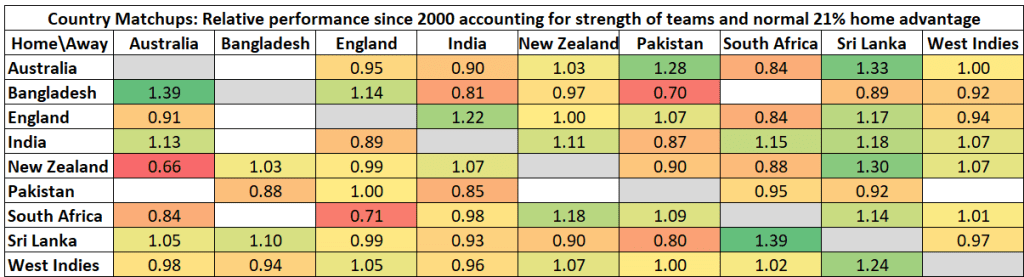
That 21% happens to be the average Home Advantage over the last 20 years. For the penultimate table, I’ll take the ratio of the first two tables, and adjust for the “normal” 21% home advantage to be left with specific additional adjustment factors for when two teams play each other.
This is noisy- reds and greens everywhere. Time for some judgement: I don’t think one can rely on the data for pairs of countries, because for some pairs of teams there just aren’t enough games. Instead I’ve grouped teams to pick up bigger trends.
Findings
India & Australia get an average 27% home advantage (for most teams it’s 21%)
Asian teams in SENA (South Africa, England, New Zealand, Australia) countries do on average 10% worse than expected.
Sri Lanka don’t travel well
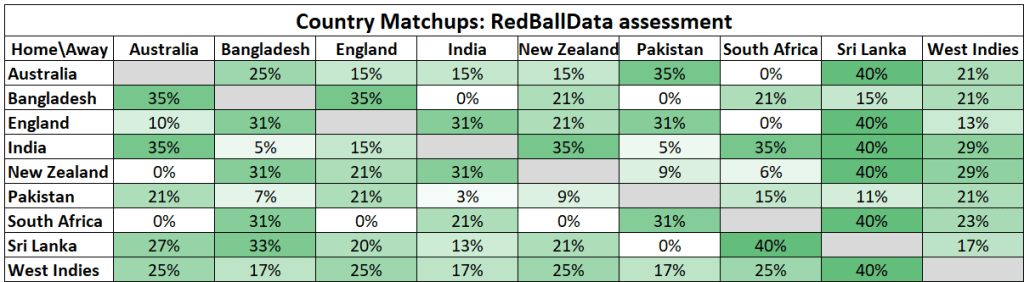
Based on that, here’s an adjusted version:
Home advantage (%) for specific pairs of teams – after adjustments made by me. For example, Australia get a 25% boost hosting Bangladesh
This analysis is crude. I’m not totally persuaded by it (yet). Such as why are New Zealand terrible in South Africa, when crudely similar teams like Australia and England do well there? Would we expect that trend to continue? Is it too reductive to assign characteristics to nations rather than specific players?* Perhaps, but if it helps understand why teams are winning then I’ll use it.
For instance, South Africa have a habit of beating England in England. This could be because conditions are similar in the two countries, so England lack their usual home advantage.
I’ll keep an eye on this in 2021. The four remaining series in 2020/21 are all fairly normal for home advantage. Relevant to the World Test Championship final, it’s worth noting the raw data for India and Pakistan in England hints that the location of the final suits Pakistan more than India.
Another good test for this approach will be India touring England next summer. Is this Indian team (armed with Bumrah), sufficiently talented in the pace department to avenge the 4-1 defeat from 2018? If so, that will hint that Team A being forever doomed touring Team B is twaddle.
*There’s a part of me that finds this analysis distasteful too – assigning characteristics to a whole nation.
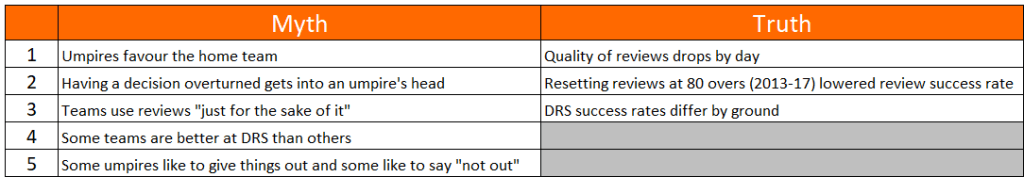
A chance to examine some of the received wisdom on the review system. I’ve got five myths and three trends to share with you.
Before we get into that, a summary. Over the decade of Decision Reviews, most reviews have been by the fielding team (57%). However, batsmen have had greater success overturning dismissals (35%, compared to 21% for the fielding team). The 907 overturned decisions are 6% of the wickets over the last decade, so while umpires are getting the overwhelming majority of decisions right, DRS is making a noticable difference to the accuracy of umpiring.
On with the show. Firstly, five myths:
I’m going to have to ask you to reverse your opinions
Myth 1 – Umpires favour the home team
Crunching the numbers, the hosts and visitors have uncovered almost exactly the same number of incorrect and borderline decisions. In terms of overturned decisions it’s 416-413 in favour of the home team, while the marginal decisions that haven’t been overturned (“Umpire’s Call”) have benefitted the home team slightly, with 109 reviews by the visitors being adjusted Umpire’s Call, against 100 for the home team.
If umpires were being influenced by the crowd, there would be more decisions against the away team then being overturned – this isn’t happening, so whatever home advantage is in Cricket, it’s not from umpires.
Myth 2 – Having a decision overturned gets into an umpire’s head
I took each example of an umpire who had a decision overturned, and looked at the next DRS review for that umpire on the same day in the same innings. If umpires were trying (even subconsciously) to even things up, you’d expect the umpire to give the next close one out, which the batsman would review. Putting this in terms of data, we’d look for a decision overturned against team A to be followed by a review by team B.
No evidence for this exists – of the 449 times when a decision was overturned and another review occurred on the same day, same innings, same umpire, 235 were the other side reviewing, 214 the same side. Umpires are considering each ball on its merits.
Myth 3 – Teams use reviews “just for the sake of it”
This one really surprised me. I’d expected to need to cleanse the data of the pointless reviews at the end of an innings when there’s no harm in reviewing. So I looked for those pointless reviews, but they don’t exist.
Opportunistic reviews should be visible by a dire success rate. Here’s the split of success rate by the batsman’s average:
Maybe a handful of spurious reviews from the worst batsmen, but they aren’t taking the mickey.
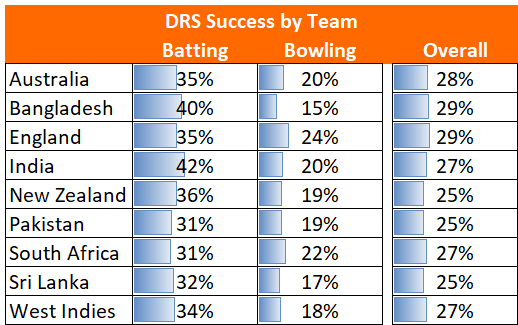
Myth 4 – Some teams are better at DRS than others
Not true – all the teams are very tightly bunched. I’ve excluded Afghanistan (30%), Ireland (50%) and Zimbabwe (30%) as they just haven’t played enough.
Myth 5 – Some umpires like to give things out and some like to say “not out”
There are two ways this would manifest itself for Outers: “Umpire’s Call” would tend to be batsmen reviewing balls, clipping the stumps, that were given out; and the proportion of successful reviews would be higher for batsmen.
Because of the small sample sizes, it looks like there are trends, but when you put the two methodologies side by side, the pattern disappears. Which is a shame, because I’d hoped that the umpires who were bowlers would be Outers and those that were batsmen would be Not Outers. Turns out Elite Umpires are just professionals. Here’s the chart for good measure.
Now for the true trends
Stay with your original opinions; you’re on screen now.
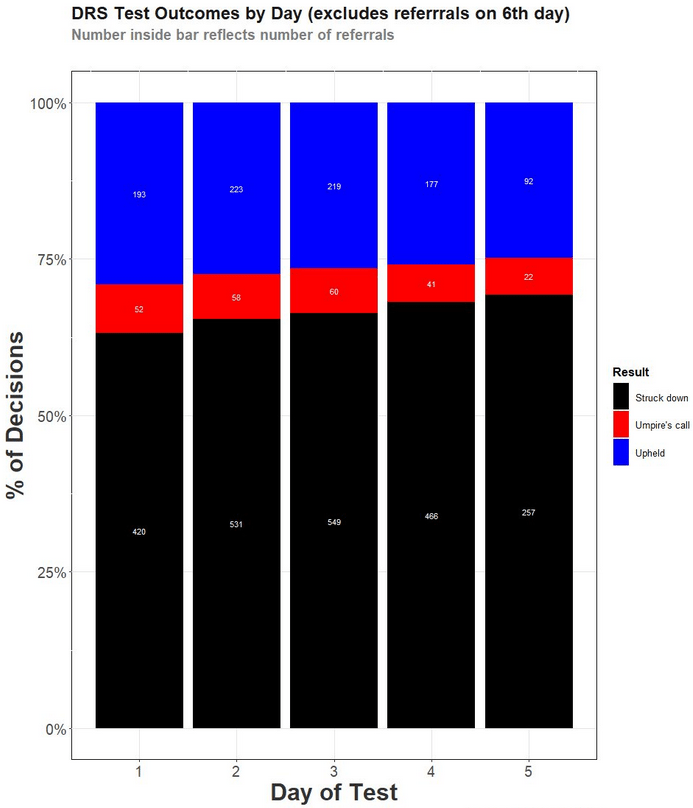
Trend 1 – Quality of reviews drops by day
Tony Corke (@matterofstats) got in before me with this trend – here’s the chart he produced
The long term trend is fairly consistent – flitting around the 27% mark. Except for 2014 and 2015. I think I can explain that dip.
In 2013 a rule was brought in whereby reviews reset after 80 overs. This was to avoid punishing a team who lost reviews to marginal decisions. A better rule took over from autumn 2017 – “Umpire’s Call” decisions would not cost a review.
The impact of the resetting reviews was felt in overs 60-80: teams were in a position of “use it or lose it”, so did the logical thing and reviewed liberally. Thus, from 2013-16 the success rate in overs 60-80 was only 20%, having been 28% for those overs before 2013. Naturally, once the new rules took over from 2017, the success rate for overs 60-80 returned to 28%.
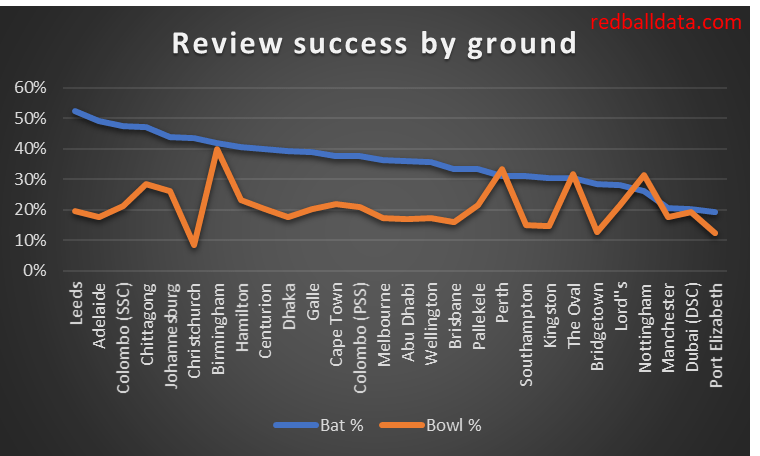
Trend 3 – DRS success rates differ by ground
The harder batting conditions are, the better the relative performance of fielding reviews versus batting reviews. Any scatter plot for this looks ugly, so you’ll just have to take my word for it that this is a statistically significant correlation. In lieu of that, here’s a chart of batting and bowling DRS success rates by ground.
Now, I’m not sure which way the causation runs. One possibility is that at high scoring grounds the umpires get lulled into thinking batsmen aren’t going to get out, so they don’t believe their eyes when a batsman is out.
The key point I’d like you to take from this is just how consistent umpires are.
When should you consolidate? I’ve devised a general rule to calculate when the batting team should slow down and conserve wickets.
Let’s recap the current state of T20 International batting. Teams usually end their innings with wickets in hand. Since 2016 the average first innings score is 166-6*. Teams rarely get bowled out, having enough batting depth to attack throughout, even if a wicket falls early on.
Looking at this another way, on average it takes more than 120 balls to bowl a team out. The openers can go out and play naturally, expecting the top seven to do the business. The number eight batsman averages only three balls per game. I think of limited overs batting in terms of “Expected Balls”: how long would you expect it to take to bowl this team out if they were batting normally? For example, England bat deep, expecting to last 172 balls before being bowled out – this gives them licence to attack in a game that’s only 120 balls long.
~~~
The more you get in the first innings, the higher your chance of victory. But get greedy, take too many risks, and you may fall short of a middling score that might have been enough. Any approach to batting has a range of possible outcomes. The goal is to pick the approach that maximises expected win %. How do you do that?
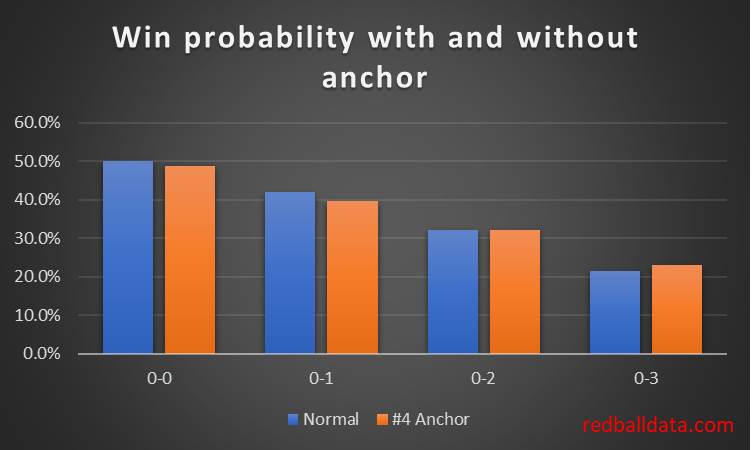
Here’s one example – consider a binary choice where number four in the first innings can either bat normally or anchor (Strike Rate down 10%, Average 20% higher). According to my model, for this current England T20 team, pre innings or at 0-1 anchoring is not optimal. 0-2 it’s marginal. It’s only worthwhile if you’ve slumped to 0-3. Which, coincidentally, is the point at which England’s expected balls drops below 120 (ie. they run the risk of the median innings not lasting 20 overs). This makes intuitive sense: tailor your batting aggression so you almost (but not quite) get bowled out.
Note this assumes England are playing against an equally talented team – hence win % pre game is 50%
The general rule: bat normally unless Expected Balls < Balls Remaining.
A recent example – England were 34-3 (5.3) – which looks precarious, but the Bairstow-Stokes-Morgan middle order meant it was more-likely-than-not that England would bat all 20 overs, and have a reasonable chance of chasing their 180 target. England won the game in the 20th over. Maybe that “lose three wickets in the powerplay, lose the game” maxim is outdated as T20 averages improve. For England, Expected Balls exceeded Balls Remaining, even having lost three wickets in the powerplay.
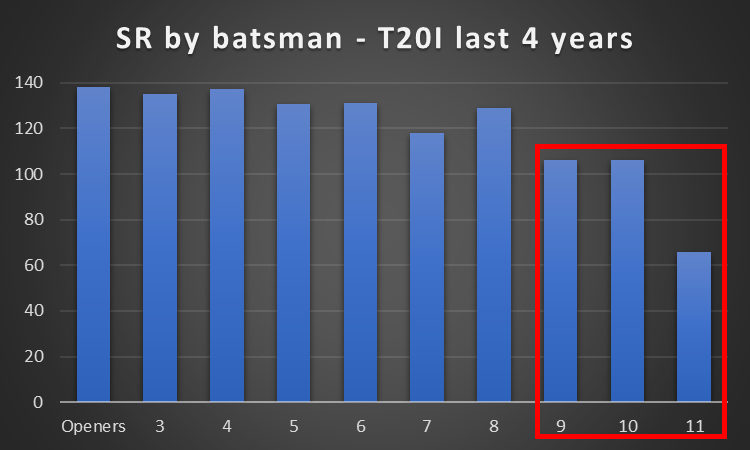
But this is too simplistic. Not everyone can strike at 150: you can’t expect fireworks from every tail. Here’s the strike rates of the top 10 T20I teams over the last five years. Numbers 9-11 just aren’t as good. I think of teams “Running out of steam” when all the quick scorers are out.**
“Running Out Of Steam” depends of the composition of one’s batting order. England currently have Jofra Archer at number nine. Deep. West Indies aren’t so lucky – Keemo Paul bats at eight with a domestic career SR of 107 – so they Run Out Of Steam at six down.
My hunch is that cricketers know what their tail is like, and how likely it is that tail will be exposed, and bat accordingly. Take another recent example – WI T20 #1 – at 59-5 (5.1) West Indies were vulnerable. One more wicket and they were done for. So Pollard and Allen consolidated, taking 37 from the next five overs. A rain interruption meant the innings was reduced to 16 overs. With just six overs left – it was time to attack, lifting the score to 180 by the end of the innings. Subsequent discussion focussed on the impressive assault, missing the responsible consolidation period that made it possible.
~~~
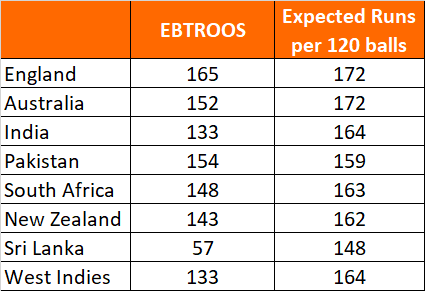
Here’s the “Balls to Run Out Of Steam”*** for the Top 8 T20I sides, based on their most recent XI
As at December 2020
This tells us that England, Australia and Pakistan have the capacity to score more quickly than each player’s career record (ie. if they bat naturally, they are wasting resources by being too conservative). If wickets fall, that should be reassessed****.
Note Sri Lanka put out a particularly weak XI in their last game. Numbers four and below would expect to strike at below 130 – way off the pace. Hence they run out of hitters unusually quickly.
Teams should tailor their aggression, aiming to not quite run out of steam. To do this, throughout the innings the batting team should compare EBTROOS to balls remaining, adjusting the EBTROOS as wickets fall.
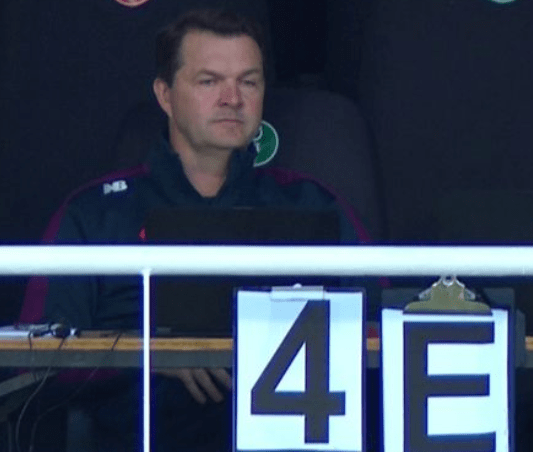
Just imagine those clipboards showing live updates of Expected Balls To Run Out Of Steam, and Optimum Strike Rate. (Screenshot from Sky Sports)
Footnotes
*Top 10 teams against each other. Sorry Luxembourg.
**I wish I was good at writing. Spent ages trying to come up with a better name for it than “running out of steam”. Ideas welcome.
***BTROOS = Balls To Run Out Of Steam. This is clunky stuff.
**** There’s an added complexity which I’ll keep for the footnotes: median innings length is not the same as balls per wicket. The difference is only 4% at the start of the innings, but gets bigger as fewer wickets are left. Here’s the same table, but with Median Balls To Run Out Of Steam*****. MBTROOS = Median Balls To Run Out Of Steam. Perhaps MBTROOS could rhyme with albatross. Anyway, here’s the MBTROOS for the latest England T20 lineup:
MBTROOS for England. Note 3 down after the powerplay would mean MBTROOS 86, which are two balls more than the 84 remaining. So keep attacking!
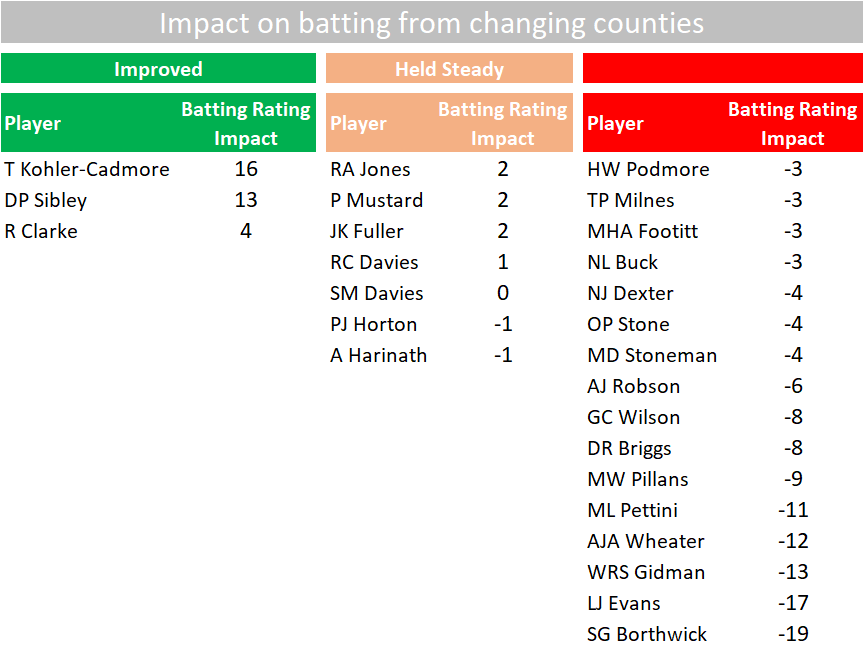
In a recent article for “County Cricket Matters” magazine, I looked at the impact of changing counties on a batsman’s average. You can buy it here.
The main conclusion was that a transfer tends to negatively impacts batting.
A surprising observation was that younger players are more adaptable and may improve, while the over thirties rarely benefit from a move. Small sample sizes, so just a tantalising hypothesis for now.
This data covered 2016-2019. The curtailed 2020 season was too short to extend the analysis, so we’ll have to wait for 2021 to see if I’m onto something.
P.S. Much of my analysis considers trends such as these. Since we’ve had two years’ since this blog began, at some point I’ll check if those trends continued. Trends that continue after you’ve noticed them are much more valuable than mere things-that-have-been-true-lately.
Modelling a chase is hard. I was looking for a rule of thumb: a quick calculation that could support the monte-carlo simulation I run. And here it is:
Decimal odds of chasing team winning = 1 + (Required Runs/Expected Runs)^8
Jonas (@cric_analytics)
Jonas gave the example of Australia needing 145 more to win an ODI against England. He thought Australia could on average expect to score 110 from their last 20 overs. Australia’s decimal odds were thus 1+(145/110)^8 = 10.1 (or roughly a 10% chance of winning).
To successfully unpack (or steal!) the formula, the element that needs a bit of thought is “Expected Runs”. We can use Duckworth-Lewis, combined with ground data to give an approximation. 20 overs & 5 wickets left meant 38.6% of resources remaining. On a 285 par pitch, that’s the 110 Expected Runs that Jonas calculated.
Taking the formula one step further, “Expected Runs” can be adjusted for the quality of the batting and bowling teams to give a more precise calculation for a specific run chase. I have added this expanded formula to my model to better understand who is winning and why.
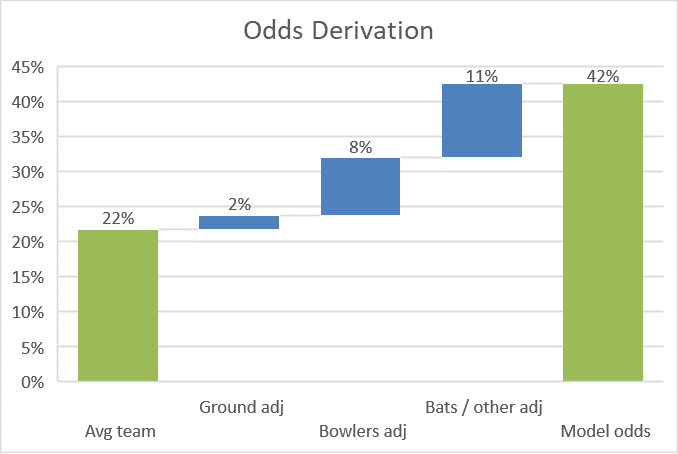
Here’s an example of what this looked like when Australia were 222-5, needing another 81 from the last 10 overs (third ODI, 16th Sept 2020):
Aus 222-5 (40). Maxwell 74* Carey 77*. Target 303.
The raw formula gave Australia a 22% chance with 26.1% of resources remaining (Expected Runs = 69, on the basis that a normal par score is 264 – that may be an underestimate as scores keep rising). However Old Trafford slightly favours the batsmen, and England’s attack is sub par – lifting Australia to 32%.
My model had Australia at a 42% chance – the extra 10% coming from the strength of Australian batting, the two batsmen being set, and any other differences between my model’s Monte Carlo simulation and Jonas’ formula. The right hand column is the output of my model, and the penultimate column is the one that goes haywire if something is wrong: a useful check.
What’s the message? Firstly, if the model is working, I can see who is winning during a chase and why. Secondly, matchups and other complexity have made my model something of a “black box” – Jonas’ formula will be a useful check that my model isn’t off piste.
I rated the county 20-20 batting in one hour of analysis. Reckon I need to understand 20-20 eventually.
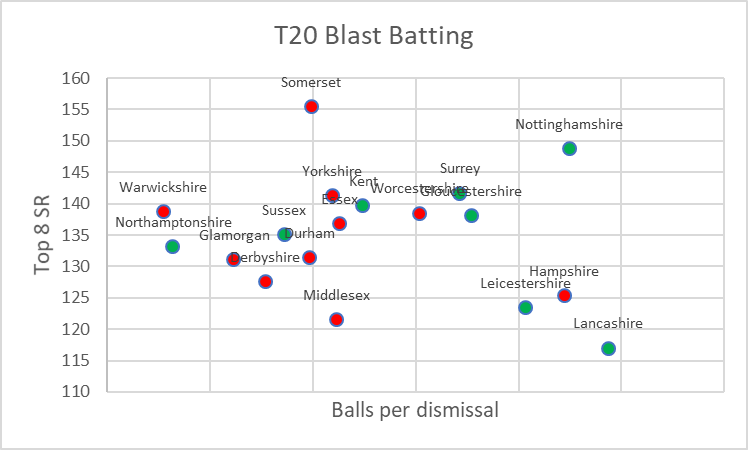
My starting position: scoring quickly is good but getting out is bad. Thus the best teams will score quickly, with high “balls per dismissal”.
Here’s how that looks for this year’s teams (rated using the most commonly used XI this year):
Quarter final qualifiers in green, eliminated teams in red. Only the top eight batsmen’s SR has been included as the tail rarely bats, but the whole team has been included in the BPD calculation.
Averages matter
Surrey and Gloucestershire score just as quickly as Yorkshire and Kent, but with higher balls per wicket they are less likely to fail – so are more consistent and better batting units.
I had heard that averages don’t matter in 20-20: I think they do.
A team has to be confident of lasting 120 balls. I don’t know how many balls you need to expect the unit to survive before getting bowled out in 120 becomes unlikely – maybe 180? Only three teams on the right of this chart are at that level. Once all teams are there then wickets cease to be a limiting factor, and it’s all about strike rate.
Lancashire – skewed by strong bowling
Bottom right should contain bad teams: trundling to 140 and losing.
Yet Lancashire won five games this summer with a team where no-one has a four year SR over 135. They even scored 190 (SR 158) against Durham. What’s going on?
The key is that they are a strong bowling team that often have easy chases. They thus play within themselves to secure the win. This makes their players look like plodders. Yet batting first they score 177 on average over the last two years. While chasing that drops to 129.*
Lancashire’s true position on the chart would be somewhere up and to the left. Repeating this chart with first innings data would help.
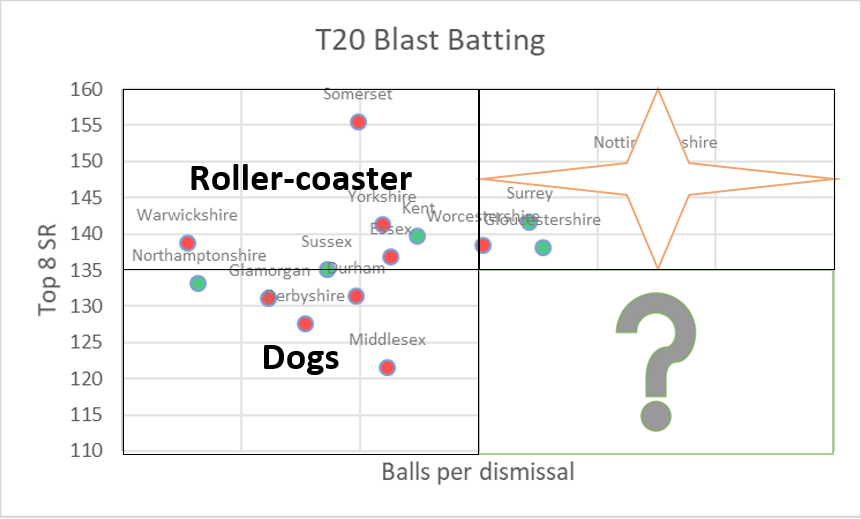
Here’s my attempt at a Boston Consulting Group** view of T20 team batting:
Stars: good teams. Dogs: bad teams. Question marks: Could be bad teams, could be players looking slow from chasing small totals. Roller-coasters: Might score 200 one game, 105 all out the next.
I’ve only looked at the batting, but I feel like this view might have some predictive power. 2/6 Dogs qualified, 1/5 Roller-coasters, 2/3 Question Marks, 3/4 Stars. The three Stars were the three group winners.
*Data up to 19th Sept 2020.
** Boston Consulting Group suggested in 1970 that companies could consider any product as being one of four types in a market (Star, Dog, Question Mark, Cash Cow). I’ve ripped off their idea to try to look like I know about business as well as cricket.
This year’s Bob Willis Trophy was entertaining. I’m glad the counties and the ECB made it work. It was the right format for a condensed season, and the Essex / Somerset final should get the attention it deserves.
The setup looks like it will be broadly maintained next season. The expected structure is ten games in three conferences to sort teams into three divisions, four further games within those divisions, and a final for each division.
While there are merits to this structure, there are also risks: specifically mismatches and the dilution of talent. I’m going to show you the key weaknesses in the format by looking at the 2020 tournament.
1. Mismatches
Two divisions ensures a smaller step from CCD1 to Test cricket. Yet under the new structure, a good chunk of the ten games at the conference level (ie. the first part of the season) will be against weaker teams.
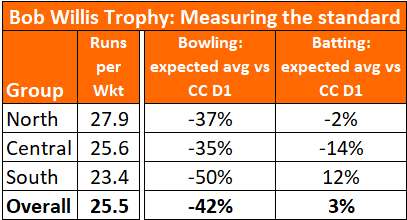
I can show you this with data – comparing how players did this year versus their four-year domestic record. Because there was no mixing between groups, we can look at each conference separately:
Note that a negative impact for bowlers means you would expect them to record a lower average (eg. a bowler who would average 30 in CC D1 would expect to average 18.9 in the BWT North group).
I estimate the overall standard was 19% lower than CC D1, with conditions 22% harder for batting (perhaps pitches were understandably not in as good nick as usual, perhaps batsmen need more preparation than bowlers). That’s a big step up to Test cricket.
Is it sensible to establish a competition where Simon Harmer’s expected average is 14? This year was unusual; longer term the red and white ball England squads need to be available for county duty as much as possible, else the cricketing value of the championship will be diminished. My prediction – a year or two of the best bowlers averaging 10-15 would drive Test selectors to look to the IPL and CPL for performances against the best (if their heads aren’t already turned in that direction).
Of course, exceptional circumstances meant squads were unusually depleted (no overseas players; many foreign-based cricketers were unavailable until the Blast; England’s red and white ball teams were otherwise engaged). Surrey’s squad was often just a list of their available players. Even without that, the mixing means the best aren’t playing the best as often.
2. Dilution of talent
Generally, Test batsmen have been drawn from CC D1. They’ll face a variety of top bowlers there. There are still great bowlers in D2 (James Anderson and Mohammad Abbas, for example), but it’s less consistent.
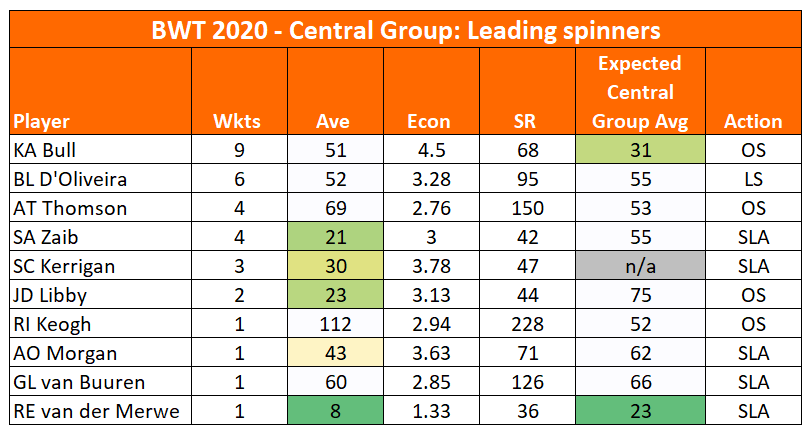
An example- this summer’s Central group was definitely light in the spin department. Here’s the top 10 spinners by wickets taken:
Nothing against these players – but would a summer in the Central division give a batsman confidence he could tour India with reliable technique against spin?
The wider point – there’s no guarantee a conference structure will provide the rounded challenges to turn a good player into an great one.
**
County cricket has to serve three purposes: to maintain tradition, to entertain, and to help the Test team flourish. The two division structure wasn’t perfect, but ticked all three boxes. The new conference structure can’t afford to fall down on the last point. For a fuller appraisal, I recommend George Dobell’s piece in this month’s Cricketer magazine.
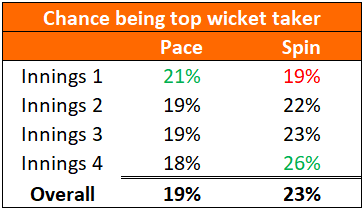
Cricket has quirks. Look at it through another lens; learn something new. Today’s angle is wicket-taking. What kinds of bowlers are the leading wicket takers in a particular innings, and what implications does that have?
Since 2010. First five bowlers used only
No surprises here. Let’s go deeper.
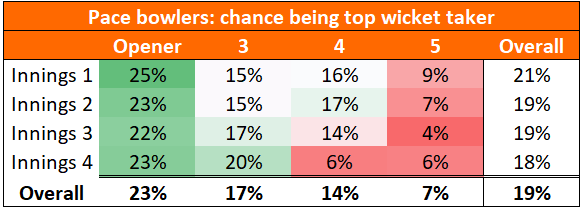
Pace bowlers by innings and by position
Since 2010. First five bowlers used only
Opening bowlers are the best pace bowlers. They also get a boost in the first morning on a fresh pitch. In later innings, they are still favourites among pace bowlers (though the spinners start to get a look-in).
First change bowlers are about two-thirds as likely to be leading wicket taker in an innings. Probably two factors – they aren’t quite as good as openers, and (more significantly), they don’t get the new ball, or first crack at the tail. In later innings their chances improve, probably because those innings are shorter, squeezing out the part time bowlers.
The fourth bowler is just as good as the third, until the second half of the match. The fifth bowler gets a reasonable go in the first innings, but not much action in the second. They are surprisingly unlikely to take the most wickets in an innings – it’s kind of a four horse race.
Pace bowlers by Ground
We haven’t the data to do much by ground, but one stadium gets two Tests a year: Lord’s.
Lord’s since 2010. First five bowlers used only
There’s a 75% chance one of the two openers is leading wicket taker in the first innings at Lord’s – batting is hard in that first hour. The change bowlers don’t really get a look in.
Until models are seriously good, they won’t always beat local knowledge. To get that I need domestic stats. Must build that database at some point.
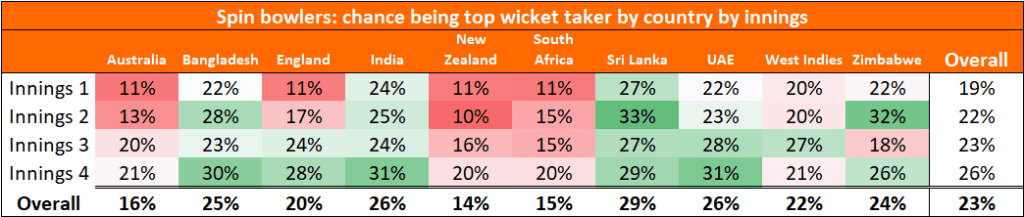
Spin bowlers by Country by innings
Never cut a spinner. Or back one to be leading wicket taker in the first innings in the SENA countries (South africa, England, New Zealand, Australia). The general trend of a gentle increase in top-wicket-taker probability from 19% in the first innings to 26% in the last is not seen worldwide. In India, Sri Lanka and Bangladesh, a front line spinner should rarely be available at longer odds than 3-1 in any innings.
(Also a reminder that spinners go from pointless to prized over the course of five days in England).
Individual players
If ye grind yer [gunpowder] too fine, it’ll blow yer bloody head off, then nobody’ll know who’s best shot; thee or me
Sharpe’s Siege
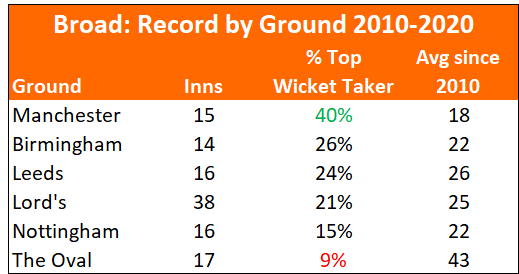
Do bowlers have preferred grounds? Almost certainly. Does it show up objectively in the data? Maybe, if you know what to look for. I’ve checked just one example: Stuart Broad. Using the data since 2010, Old Trafford was clearly his favourite ground, while The Oval was a graveyard. However, look just outside this horizon, and in Broad’s only previous Old Trafford Test he took 0-79, while in his earlier Oval Tests returned 11 wickets at 19. Regression to the mean? Maybe.
What have we learned?
Nothing earth shattering – hints at how bowling position impacts performance, a reminder that grounds can have peculiar characteristics, another reminder that the usefulness of spin through a match varies by country, and my squeamishness about small sample sizes was reinforced when looking at Broad’s record.
Call this one “knowledge consolidation” – kicking the tyres of what I think I know, and nodding approvingly at the result.


_method_of_adjusting_target_scores.PNG#/media/File:(Duckworth_Lewis)_method_of_adjusting_target_scores.PNG)