Northamptonshire were at odds of 34-1 to win Division Two before the 2019 season began. They had a lot of work to do to get into the top three.
Things didn’t get any better when Ben Cotton was released after not managing to “reach fitness targets”.
I had them as the sixth best team in early April. Here’s what I said on the twitter:
Not a bad side, but off the pace of the top of Division 2. A batsman light, better balanced with Bavuma replacing Holder on 14 May. A shallow squad – @NorthantsCCC may have to prioritise the competitions where they have the best chance of progressing.
Now they are on the cusp of reaching Division One. Just four points from their game against Gloucestershire will secure promotion. What happened?
1.Batting outperformance
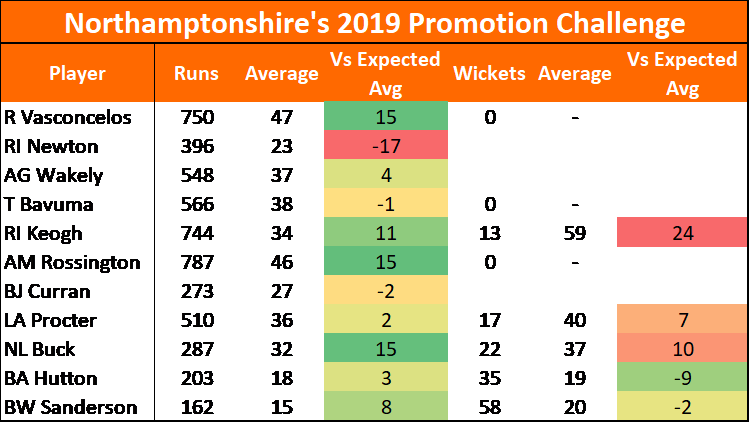
Fig 1 – Northants performance vs expectation, for an XI of the players to have featured in the most matches. Expectations based on 2016-18 red ball data.
Ricardo Vasconcelos, Adam Rossington, Rob Keogh, Nathan Buck all averaged ten or more runs above expectation.
The team as a whole averaged 53 runs per innings more than expected. I think that Rossington, Keogh and Buck had good years, and wouldn’t be expected to repeat that in 2020. Vasconcelos though. 21 years old, already has a First Class average of 37. How good could he be in a few years time?
It’s rare for a team to just have one player underperform with the bat (see the recent Ashes series). 35 batting points is the highest in the league.
2.Hutton
Ben Sanderson was always a candidate to dominate Division Two. His opening partner Brett Hutton has been the surprise package. A career average of 29 pre-summer, yet he picked up 35 wickets at 19.
Sanderson couldn’t do it on his own, Keogh, Procter & Buck bought their wickets at too high a price: without a second top bowler, it’s hard to see how Northants could have picked up five wins.
3.Sussex, Middlesex, Worcestershire
What happened guys? If time allows I’ll have a look at why these teams misfired. They are better than Northants.
What happens next?
If you believe Northamptonshire’s players have made technical changes, and they’ll play at the same level in 2020, then they could do OK in Division One. Maybe Rossington’s captaincy has made a difference.
Personally, I think there will be a lot of pressure on Sanderson, Hutton won’t repeat the heroics of this summer, and Northants won’t win many games next year.
Cricket is a batsman’s game. Whether or not that’s true, we
can add another pillar to that argument: 50 over matches two days apart hit the
bowlers harder than the batsman.
The last iteration of the Royal London One Day Cup took
place this summer. At the time, I had a look at how fatigue impacted
players, and included a stat that the “Batting Team being better rested
yielded an extra 0.23 runs per over”. Re-reading that piece, it became apparent
that I hadn’t shown my workings. Let’s put that right: I’ll not only demonstrate
the impact, but also quantify how much is that is down to bowler vs fielder
fatigue.
Step One: Demonstrate that 48 hours between matches
impact performance in the field.
Taking all bowling spells from the One Day Cup, I filtered
on just the bowlers who bowled more than 25 overs in the tournament and looked
at how they performed in each spell relative to their tournament Economy Rate.
Bowlers (and the fielding team)
Fig 1: Economy rate impact vs number of days between matches (ie. playing on the first and third of May would be two days between games).
Pretty clear trend here – if a bowler played two days beforehand, their Economy rate would be 0.16+0.06 = 0.22 runs per over higher than if they had three days between games. There’s a decent sample of 863 overs for the 3 days’ rest bucket, so the data should be reliable.
There’s also some evidence that an extra day improves Economy rate even further.
Batsmen
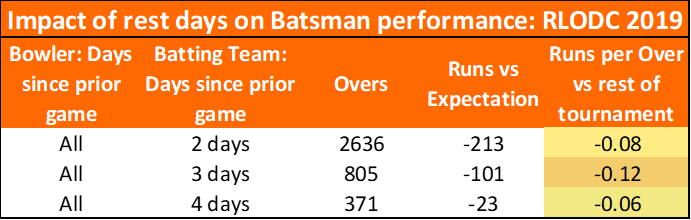
Fig 2 – As for Fig 1, but varying rest times for the Batting team
No clear trend here. 0.02 runs per over is one run per
match, so whatever the impact here it’s not big.
Step Two: Demonstrate the impact is partly bowler and partly
fielder fatigue.
We’ll start with an assumption: spinners can bowl 10 overs repeatedly without getting tired. Admittedly, the last time I bowled 18 overs in a day I tore my groin, but for professional sportsmen I think that assumption is OK.
Now we’ll break down the 2/3/4 day rest views for bowlers by the type of bowler and see how the impact varies.
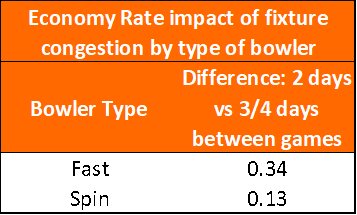
Fig 3 – Relative Economy rate impacts from fatigue for Pace vs Spin bowlers.
If the spinner isn’t tired, why is he going for more runs
when there’s two days between games? I think it’s because his fielders are a little
ragged. The odd one becomes a two, occasionally the fielder can’t quite cut the
ball off.
Interpreting the table above, playing games two days apart costs 0.13 runs per over * 50 overs = 6.5 runs due to fielder fatigue plus an extra 0.21 runs for every over a fast bowler delivers.
Discussion
When should a fast bowler be rested? I’d say it’s
at the point when an inferior player would be expected to perform better. I
came to that conclusion after reading this piece in the Daily Telegraph about Australia’s
squad rotation in the Ashes. Why were Australia
only rotating their weaker bowlers? Because the best bowlers, even tired, were
still better than the alternative. Hazlewood is irreplaceable.
This analysis could be easily extended for
20-20. I’d expect a smaller effect for the shortest form of the game as each
game takes half as long. Other factors to consider for 20-20 might be number of
games played in the last 10 days, or the number of days travelling (a run of
home games is probably less tiring than a week on the bus).
Appendix
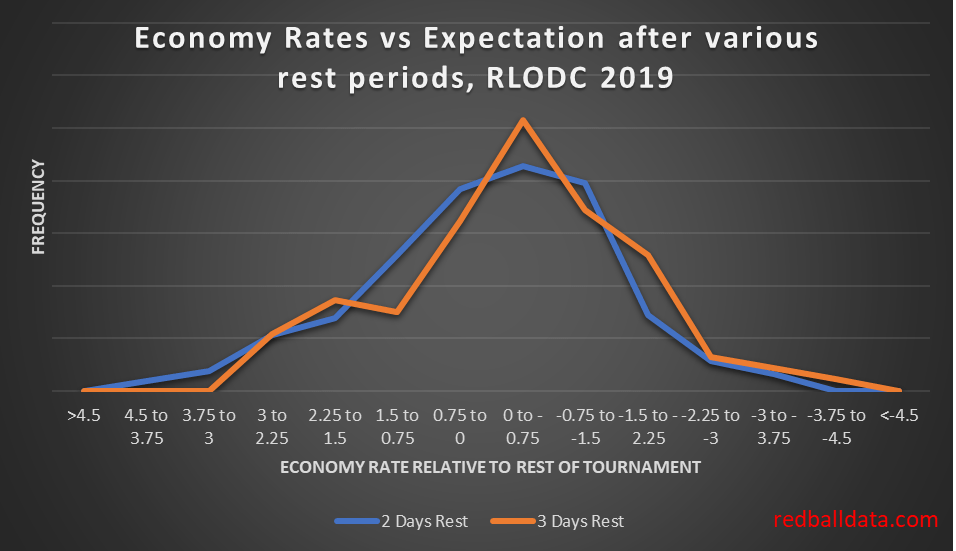
The following chart is ugly, but I just couldn’t exclude it completely – it shows that when tired, more bowlers go for a bit more than expected, and fewer go for a bit less than expected. Can’t really construct a narrative around that, though it helped persuade me that I wasn’t just inventing patterns from the data and the effect of fatigue is real.
Fig 4 – frequencies for individual player match economy rates vs their average economy rate in the 2019 Royal London One Day Cup. Minimum 25 overs bowled.
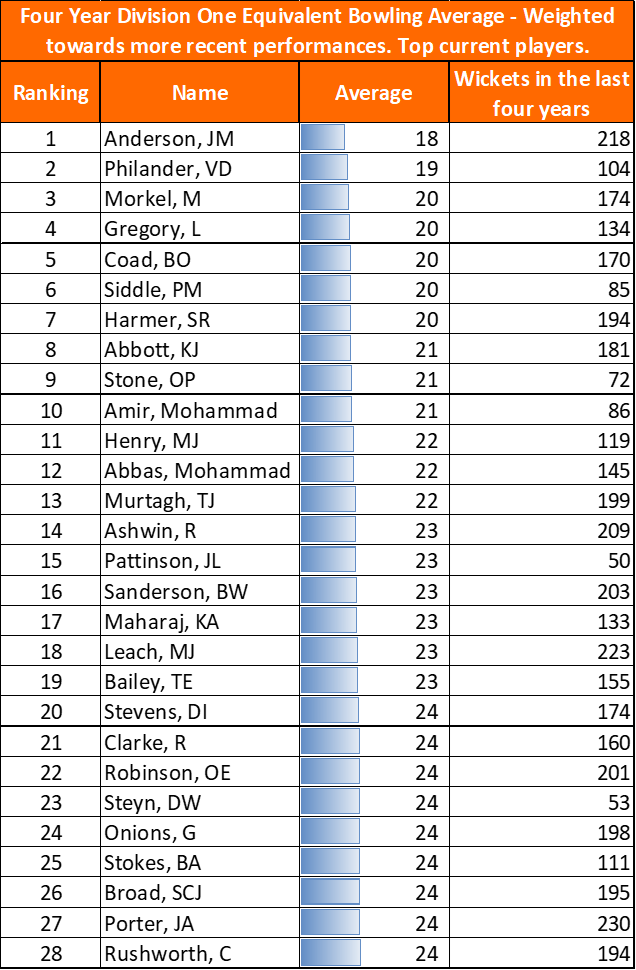
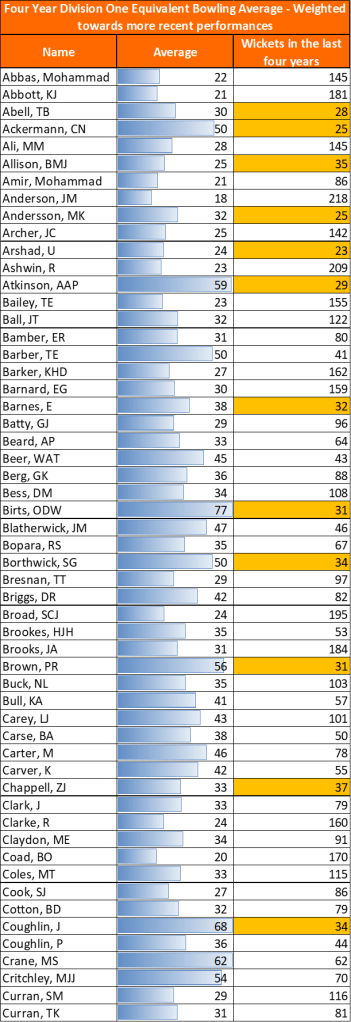
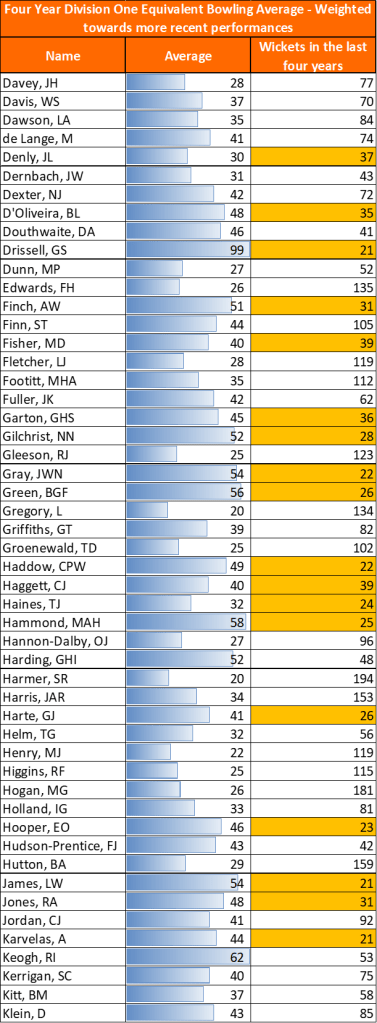
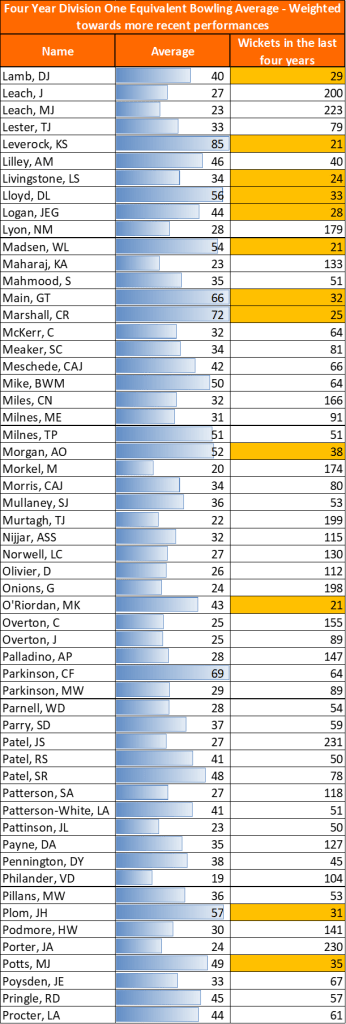
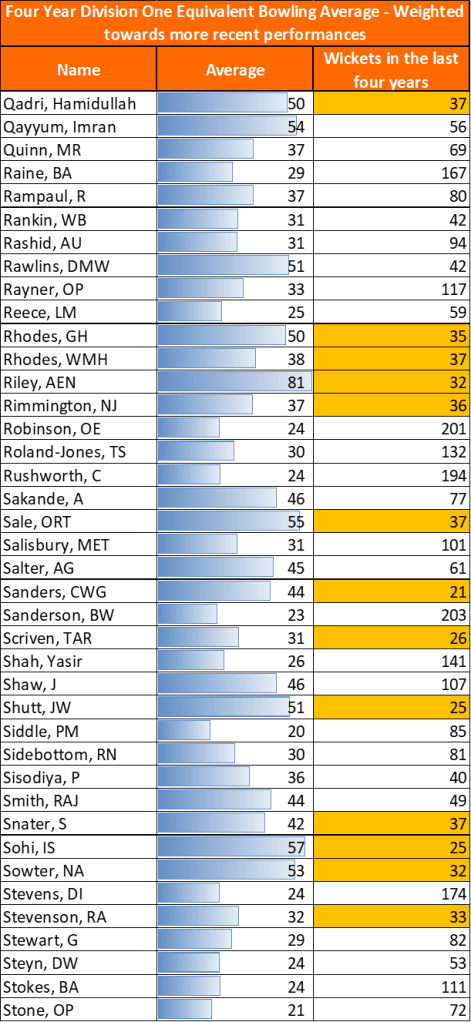
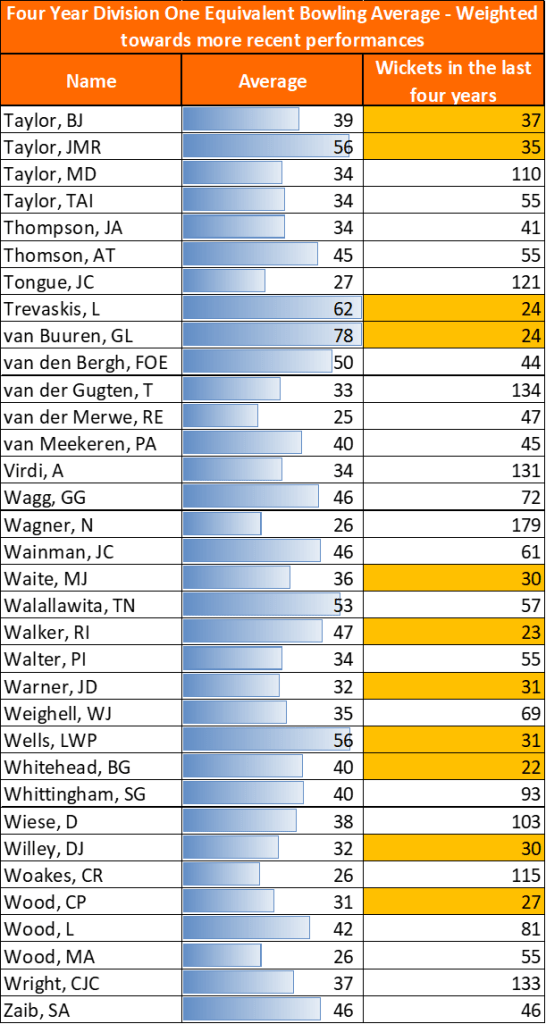
This page contains expected County Championship Division One bowling averages for all County Cricketers to have i) played during 2019; and ii) taken more than 20 wickets since 2016.
Performances in the Second Eleven Championship, County Championship and Test Cricket are included, though each performance is weighted according to the level being played at (so averaging 30 in Test Cricket is much better than averaging 40 in the Second Eleven Championship).
To give a better indication of current ability, and to partly adjust for age, ratings are weighted more heavily towards recent performances.
Ratings are shown if each player were playing in Division One – this ensures bowlers are compared on an apples-to-apples basis.
I’ll update this page periodically, as more games are played and more information is available on each player.
This version includes matches up to 23rd August 2019. For an update, see the2021 County Championship preview, which contains much more information about each player.
If you’d like to discuss, please feel free to contact me on twitter @edmundbayliss or use the contact page on this site.
In which I find that batting at seven does give your average a boost of 1.5 runs per wicket when compared to the top six.
I’d read this in Cricinfo back in 2013 and drew the conclusion that if not outs do make a difference, it’s so small I could ignore it for modelling/gambling purposes. As an aside, generally I like to look at things myself before concluding – for some reason the Cricinfo piece sufficed. Possibly because the author was trying and failing to make the case for adjusting averages to reflect not outs.
As counter-arguments go, I couldn’t rely on picking holes in someone else’s argument, I needed some data. Time for Statsguru!
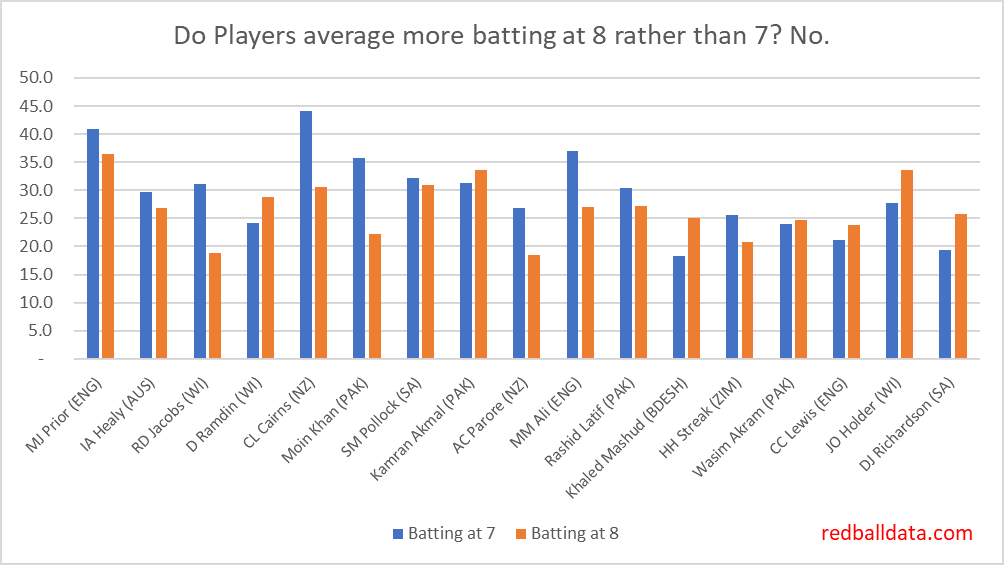
Batting at seven vs eight
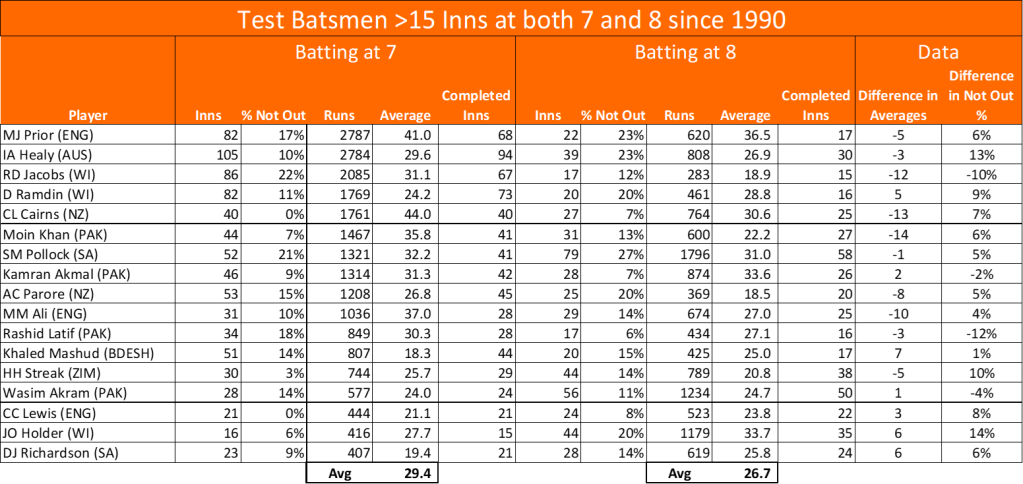
Players who have occupied both batting positions will give us the best data on the impact of those positions on average. I took players who had at least 15 completed innings in each role since 1990 and compared performance.
Fig 1 – Averages batting at seven or eight.Fig 2 – Impact of additional not outs on average for players batting at eight rather than seven. Note the wide spread of results – there’s no clear trend. Excel’s trendline says the extra not outs from batting at eight do not boost average.
There’s no clear difference between batting at seven rather than eight.
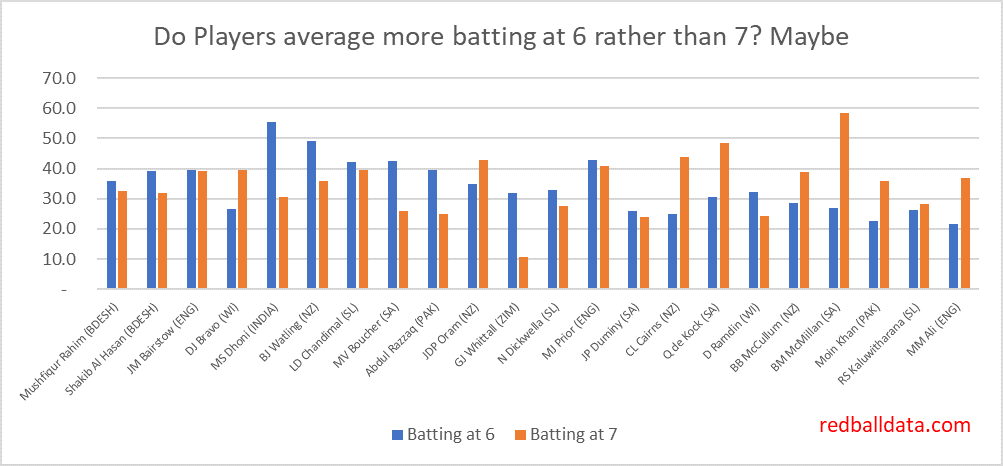
Six versus seven is where it gets more interesting…
Batting at six vs seven
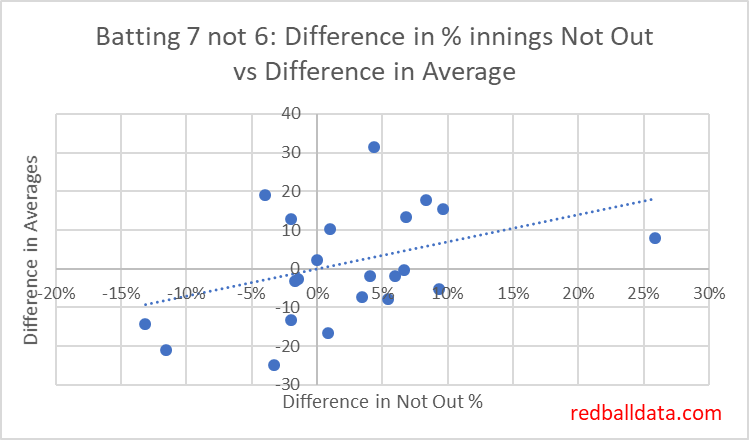
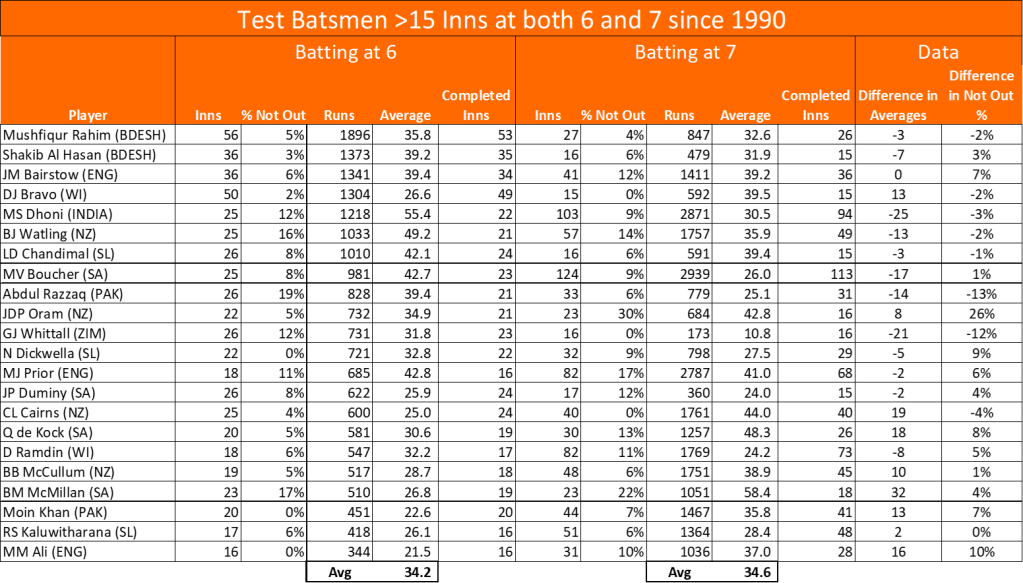
Fig 3 – Averages batting at six or seven. There seems to be a general benefit to batting at seven, but some outliers in Dhoni, Watling, Whittall. Fig 4 – Impact of additional not outs on average for players batting at seven rather than six. Now we have something. The players with more not outs tend to get a higher average. Excel’s trendline agrees – cutting from bottom left to top right.
Discussion
Let’s take stock after that whirlwind of charts. Generally, players that batted at seven got a boost to their batting average, relative to batting at six. This benefit correlates with increased proportion of not outs when batting lower down.
There is no extra benefit from batting at eight rather than seven. But – that is not to say that there’s no overall benefit to batting at eight rather than six: it’s just that batting at eight has the same benefit as batting at seven rather than six.
I’m no fan of the proposals put forward so far for punishing players for being not out. Yet being not out is correlated with higher averages.
A suggested mechanism: Outrunning Bears
Remember the old joke: two guys, out in the forest, chance upon a bear. The bear starts wandering towards them, and one chap starts tying his shoelaces. Second guy asks “what are you doing – that won’t help you outrun the bear?” First guy answers “I don’t need to outrun the bear, I just need to outrun you”.
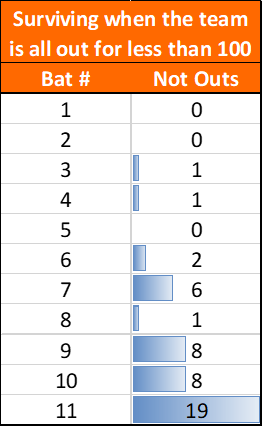
In nightmarish batting conditions, the top order have next to no chance of protecting their average. Only one batsman outruns the bear to be not out. There’s an advantage of being the last good batsman in the lineup – you just have to survive while the tail gets blown away, and it’s like the barrage never happened – your average is unscathed.
Fig 5 – Batting position of the not out batsman when a Test team has been bowled out for less than 100 since 1990 (top six Test teams only)
There we have it – number seven is having his average flattered because when the going gets tough, the number seven gets red ink. Well, 13% of the time anyway.
Extend that to all tricky batting situations, and there is likely to be a real impact to averages: the top six rarely get a not out in tricky conditions, that benefit belongs to numbers seven to eleven.
Conclusion
Let’s go back to the original question – is Woakes’ batting average benefiting from coming in at eight? I think so.
Can I quantify it? Not yet. All I’ve shown is that the lower batsman are more likely to survive in bad conditions, yet how often do they miss out on the best batting situations? If a team ends 400/4 declared, numbers seven and eight don’t see any of that action.
Does it matter? If comparing two players who bat in the same position then there’s no impact on their data. If comparing a seven and a six’s record, then yes – a rule of thumb would be:
Average adjustment = -70 * (additional not out % from batting at seven not six)
Which works out as about -1.5 runs in moving from seven to six.
Further reading
The Institute & Faculty of Actuaries know a thing or two about risk. Their take is here. I didn’t find it persuasive.
Appendix: Detailed Data
Fig 6 – Full list, batsmen with more than 15 completed innings batting at seven and eight in Tests since 1990. Fig 7 – Full list, batsmen with more than 15 completed innings batting at six and seven in Tests since 1990.
When I was at university there was a rumour that one of the Geology professors was about to predict a massive earthquake in South America. This would have been a career limiting move if nothing happened.
In the end neither the bold prediction or the earthquake materialised.
I thought of that professor’s reputational gamble when I had the idea of asking whether Chris Woakes might be preferred to James Anderson for the Fourth Ashes Test. To misquote Nasser Hussain, “No Ed Bayliss, you cannot do that.”
The scenario
If you are reading this years from now, Sir James Anderson is currently England’s best bowler, though he doesn’t bat very well. Woakes is a decent batsman, and almost good enough to get into the England team as a bowler. Woakes shores up a mediocre top seven and gives the team balance, especially as Jack Leach is a non-batting spinner. Anderson pulled up during the first Test with a calf injury. He missed the next two Tests and has been added to the squad for the fourth. The series is level 1-1 with two to play. Current speculation is that Woakes might make way for Anderson.
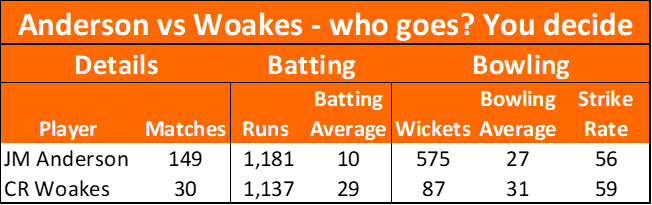
Fig 1 – Career Test records
When weighing the merit of the two players, I’ll look at two factors: England and Australia’s expected runs. To do this, I’ll run my model using each player’s career record as the input* and see how the different teams fare.
Batting
If Woakes were dropped, England would have Broad, Leach and Anderson as a long tail. That means a higher probability that a good batsmen gets left stranded and not out. The following table shows the impact on expected runs over the course of a match of replacing Woakes with Anderson and rejigging the batting order:
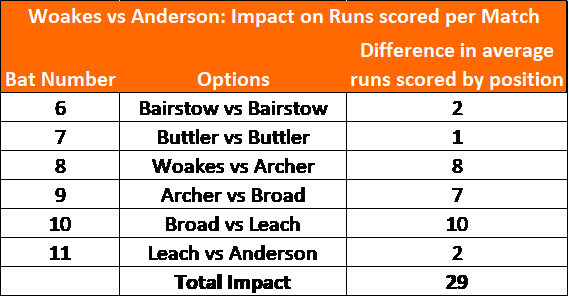
Fig 2: Comparing modelled runs scored per Match by batting position in the two scenarios. Note that Bairstow would expect to score two runs fewer per game as a result of more frequently running out of partners.
England would expect to score 29 runs fewer per match with Anderson rather than Woakes.
Interesting that Broad batting at ten outscores Leach in that position by so much – I think it’s because the likely partnerships with Leach at ten (9th wicket: Broad-Leach, 10th wicket: Leach-Anderson) won’t last long.
Bowling
From a bowling perspective, Anderson has an average that’s four runs per wicket better than Woakes. Their strike rates are similar (Anderson 56, Woakes 59). It’s likely this gap is narrower in English conditions (both average 23 at home), but let’s use the raw data rather than run the risk of flattering Woakes.
Note that England have a solid fifth bowler in Ben Stokes, (unlike some teams that would need to use a part-timer if they are bowling all day).
Running this through the model, adjusting for home advantage and Austalia’s brittle batting order, the benefit of Anderson’s bowling over Woakes is 13 runs per match. Not enough to offset the weaker batting.
That seems a little low to me, four wickets per match at four extra runs per wicket would be 16 runs – I think it ends up lower because Australia are away from home and aren’t that strong at batting.
Conclusions
Bringing Anderson into the team for Woakes would be a mistake. Maybe there’s a case for such a change in a must-win match (as the odds of a draw are reduced), but the model does not support such a change for the fourth Test.
It’s important to put this analysis into context. I’m not saying that all specialist bowlers should be replaced by all-rounders. Nor am I saying that Anderson shouldn’t be in the team because he can’t bat.
The head-to-head between Woakes and Anderson is considered in this specific scenario where England have a high quality fifth bowler (Test average 32), but two weak batsmen in Broad and Leach.
James Anderson is England’s best bowler. If fit he should play. If Anderson is fit one needs to reframe the question: you can pick two of Woakes, Broad and Archer. Just make sure one of them is Woakes. Whatever you do, don’t bring in Anderson for Woakes.
*This might be slightly contentious. Any debate on this topic (though the participant may not realise it) will boil down to whether they believe that career record is the right input to use. For example, I’m not making an adjustment for Woakes’ unusually strong home record, nor am I adjusting to reflect more recent performances (which would boost Anderson’s bowling). Nor am I adjusting because Woakes hasn’t scored many runs this series.
Would you expect players to be disadvantaged by making their debut overseas? Surely the best players get picked and have a decent run in the side until there’s sufficient data to disprove the analysis that got them selected in the first place?
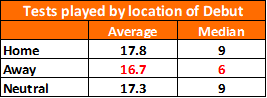
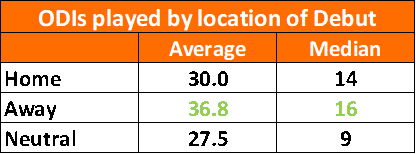
Afraid not. Away Debutants are discriminated against! Debut at
home you can expect a nine Test career. If your first game is an away match, that
drops to six.
Fig 1 – Average (Mean) and Median Tests played by location of Debut. Includes top nine Test teams, since 2005.
A reminder – home advantage in Test Cricket is big. Somewhere around 17%, depending on how you cut the data. If your expected batting average is 35, that’s 38 at home and 32 away. A player who starts their career overseas is likely to underperform, and is at greater risk of being dropped when the naïve assertion is made “OK, they have a decent First Class Average, but they are only averaging 29 in Tests.”
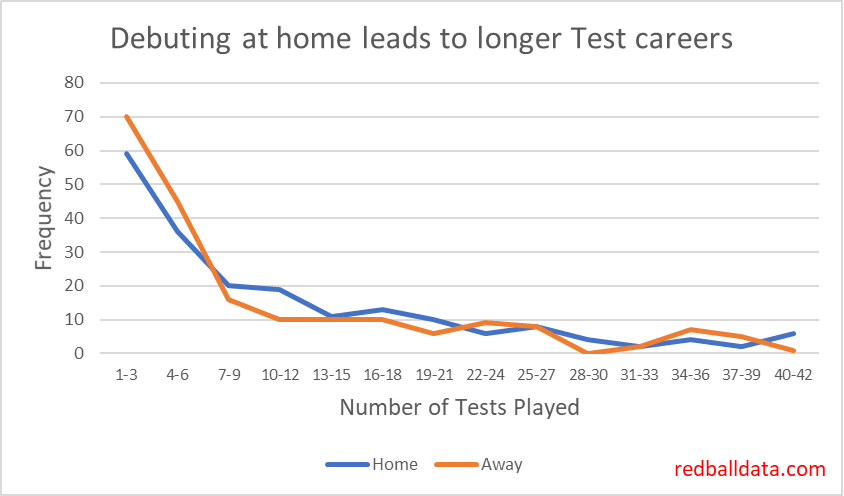
Half of Away Debutants don’t make it to seven Tests. And yet
the mean number of Tests played by Home Debutants is only 1.1 matches more than
Away Debutants. For some reason the early benefit to Home Debutants doesn’t
persist. What happens after seven Tests to explain that?
Fig 2 – Frequencies of Number of Tests played. Includes top nine Test teams, since 2005.
The behaviour flips – from Tests 7-20 more Home Debutants are discarded than Away Debutants. I expect that this is because some players who had an easy home series to get into Test Cricket then get caught out when away from home.
After 20 Tests, a player has generally played a similar
numbers of home and away Tests, so there’s no great difference between the two
curves.
So What?
Some Away Debutants play fewer Tests than they deserve. Conversely, some Home Debutants are kept in the team longer than they should be as a result of the stats boost they get from playing more home Tests than away.
It’s time to move on from raw averages. Adjusted averages are the future. Not just adjusted for home/away, but also the ground they are playing on (think Headingley vs The Oval), the quality of opposition and the innings number. This is not a complicated task, and I’d be very surprised if it isn’t already happening behind closed doors. Admittedly I haven’t yet done this when rating Test players. But then, this is a hobby for me. Also, until a player has played 20 matches, I use their First Class average to appraise them. Which is coincidentally the point at which Debut Location ceases to matter as an input.
Don’t make your Test Debut in an away game if you can help it. I appreciate this is not practical advice, so instead, if anyone reading this has made their Debut in an away game, make sure you quote your home/away adjusted average whenever possible!Ebadot Hossain, am looking at you.
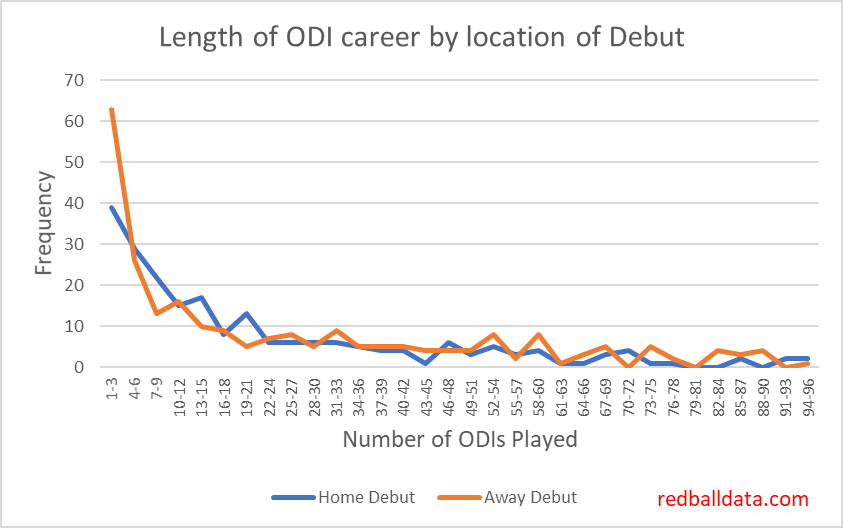
It’s almost the same story for ODIs
A quick calculation says Home Advantage in ODIs is c.11%, so we would expect ODI debutants to have similar trends to Tests. Which is true for matches 0-20: Away Debutants are more readily discarded after a handful of games, then Home Debutants are in the firing line from 4-20 matches.
Fig 3 – Frequencies of Number of ODIs played. Includes top nine ODI teams, since 2005.
After 20 matches it gets more interesting. Overall, Away Debutants have greater longevity on both a mean and median basis. Of the Post-2005 players with more than 100 ODI Caps, 16 began at Home, 22 began Away.
Fig 4 – Average (Mean) and Median ODIs played by location of Debut. Includes top nine teams, since 2005.
What the dickens? I can’t confidently explain this. Could have hidden it from you, but it’s interesting and therefore worth sharing, even if I don’t understand it. I’ll offer one possibility: ODI series are often tacked onto Test series, so in an away series the star Test players stay on for the ODIs, meaning that only highly regarded red ball players make the team. At home, the top Test players can more easily be rested, so lesser known players might get a go.
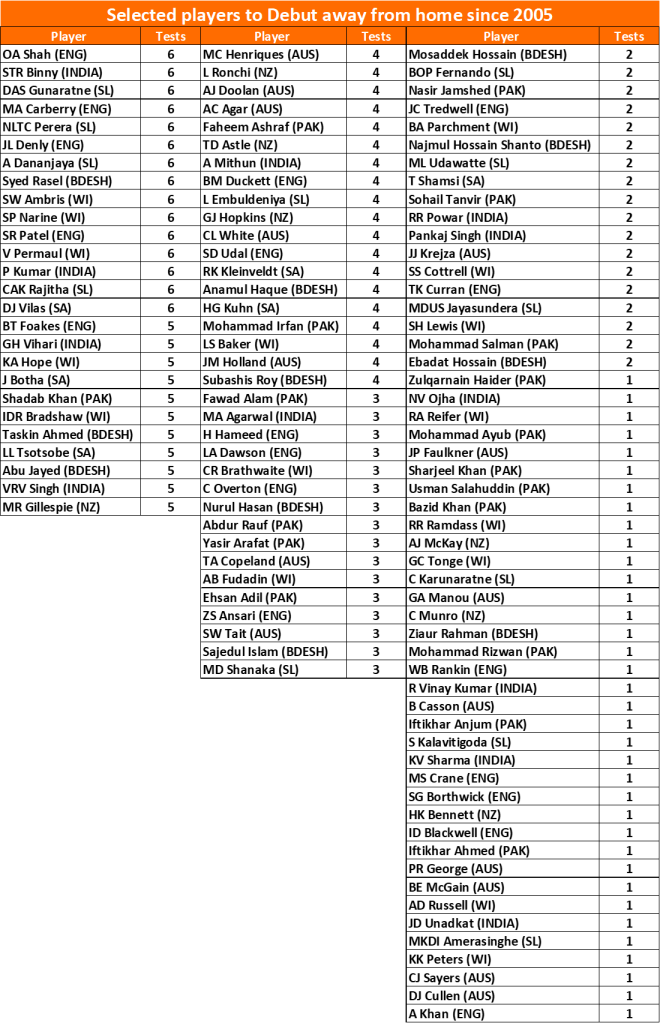
The Short List: Away Test Debutants
Below is the list of players that played fewer than seven Tests, and started away from home. Have a read, see if you can pick out some players who might have had 20 Tests if given the benefit of a home debut. Luke Ronchi and Owais Shah jump out at me.
Fig 5 – Players to Debut away from home since 2005 and play fewer than seven Tests. Data implies 20 of these players would have played 20 Tests if they had debuted at home.
When England fans are nervous, hits to my summary of their Test batting options spike. This is the companion piece for bowling, allowing me to monitor a nation’s worries about replacements for Broad and Anderson.
We’ll start by looking at how performances since 2016 translate to expected Test averages, then discuss the implications of that.
Here’s my view of the expected batting and bowling averages of the leading contenders:
Fig 1- Expected Test averages of England’s leading bowlers, based on data since 2016. Note the reversed x-axis: an ideal player would be in the top-right, a weaker player bottom-left. Anderson stands head and shoulders above the other bowling options. For the second and third Ashes Tests, the attack of Broad, Archer, Leach, Woakes, Stokes is pleasing in that all five bowlers are from the best eleven available. Fig 2 – England’s bowling options – those with expected average below 30 and selected others. Note that Archer’s white ball record implies he will be more successful than recent red ball data indicates. County Cricket performances won’t necessarily translate to Test Cricket – where pitches are flatter and games aren’t played in April/May/September in England. Stevens probably wouldn’t average 30 in Tests, but one should start with the data and adjust rather than the other way around.
Discussion
1. Older players & Succession
Five of the top 17 players are aged over 33. That means England
need clear succession plans. Conversely, it also suggests Woakes and Broad
might have more Tests in them than we think: Stevens, Anderson and Clarke have
not diminished with age.
2. Ben Coad
Coad has consistently performed well in Division 1 for Yorkshire. Last three years: 50 wickets at 21 (2017), 48 wickets at 16 (2018), 36 wickets at 25 (2019). You know how Simon Harmer has been tearing up Division 1 and winning games for Essex? He has 156 wickets at 20 since 2016; comparable with Coad’s 135 wickets at 21.
It was a surprise that Coad came out so much better than all other bowlers bar Anderson. Consistency is key – for instance Broad and Woakes had a bad year in 2017 (averaging 36 and 51 in Tests respectively).
The
next red ball Lions activity should feature Coad. It’s astonishing that he
hasn’t played yet. England weren’t far off with the Lions attack of S.Curran,
Gregory, Robinson, Leach, Porter- but they’ve got to find a way to look at Coad.
3. Division 2: Ben Sanderson and Ryan Higgins
I’d like to see Gloucestershire and Northamptonshire get promoted
to Division 1, mainly as the neatest way to get these two playing the best
standard of Cricket available. There’s a significant leap in standard between
Division 2 and Test Cricket, so without ball-by-ball data it’s hard to be sure
how good Sanderson and Higgins are.
If Gloucestershire don’t get promoted this year, I wonder if someone will have a quiet word with Mr Higgins and suggest he seek a Division 1 employer. Higgins is very good. I wrote about him here.
Sanderson is the wrong side of 30, so if he were to get a Test callup it would be following a lot of injuries to younger alternatives. Like James Hildreth he’ll be someone who could have made the step up from Under 19s to the full England side, but never got the chance.
4. Spin options
There’s only one viable spinner- Jack Leach. Even adjusting for the advantage he gets from playing at Taunton, he’s the best England have got. His batting’s not great, so in non-spinning conditions England should consider a batting all rounder instead. Maybe that’s harsh on Moeen Ali, but I think the “most wickets for England in the last 12 months” statistic flatters Ali – taking the longer view, his Test bowling average of 37 is nothing much to shout about.
5. Replacements
If Woakes or Stokes were unavailable: Gregory or Higgins are the
best batting bowlers on the list, capable of slotting in at number eight.
If Broad or Archer were injured (and Anderson still out), Coad would be the logical replacement.
I don’t see Sam Curran as being ready for Test Cricket. His bowling average of 30 flatters him when his first class average is 29: expect it to go up if he plays more Tests. He’s only 21 – for now there are better bowlers out there.
Post-script:
Methodology
To calculate expected Test averages, I took performances over the
last three-and-a-half years in Second XI, County Championship, and Test Cricket
adjusted for the relative difficulty of playing at each level.
I’m aware of two extra elements to add: weighting towards more recent performances and adjusting for age (young players should be getting better). These will take time to calculate, so will have to wait for the Autumn.
There’s a third factor I’d like to look at – the link between ODI and Test performance. Since not all players will perform equally well in red and white ball Cricket, I’m at present unsure how I’d quantify such a measure (eg. X averages 26 in ODIs, therefore is expected to average 32 bowling in Test Cricket).
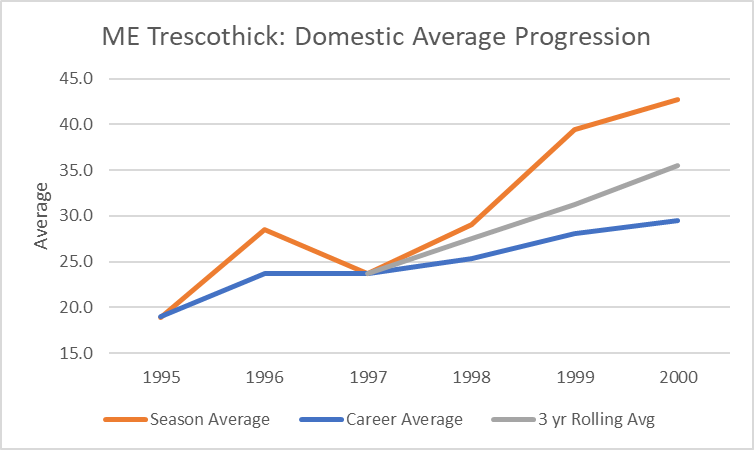
In the perennial debate “Selection: Art or Science”, one of Art’s arguments is that Michael Vaughan and Marcus Trescothick had Modest Records* before succeeding in Test Cricket. In this piece, I’ll demonstrate that there was nothing in their early international careers that couldn’t have been predicted by the right data. They had solid data behind them: we should distinguish between career stats and someone’s more meaningful recent record.
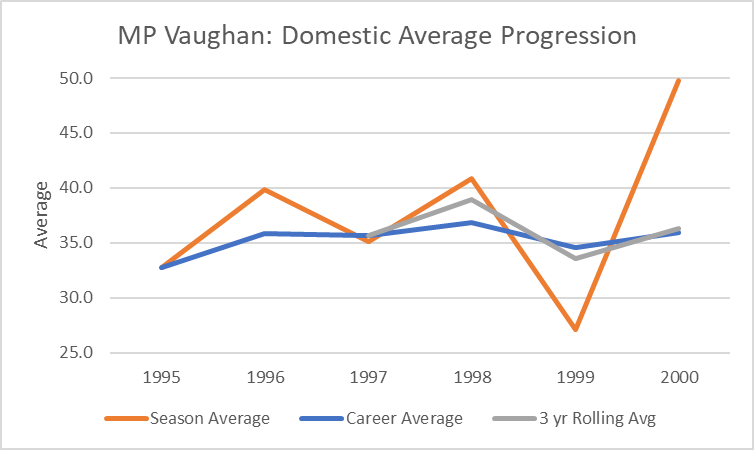
Let’s start by looking at young Michael (born 1974) and
Marcus (born 1975) developing in County Cricket.
Fig 1 – After an exceptional first few seasons note the unusual blip in Vaughan’s 1999 performance. This meant that rather than showing improvement with age, his career average hovered around 36. Fig 2 – Trescothick’s more pronounced improvement with age. Three year rolling average consistently above career average.
Using three year rolling averages, and applying the current performance difference between County Championship Division 1 and Test Cricket (28%, see link), we would expect both players to average 28 in Tests. Adjusting for age (a 25-year-old is better than they were at 23, so would be expected to outperform their three year rolling average), the data driven approach says they had expected Test averages of 29 for their first year in Test cricket.
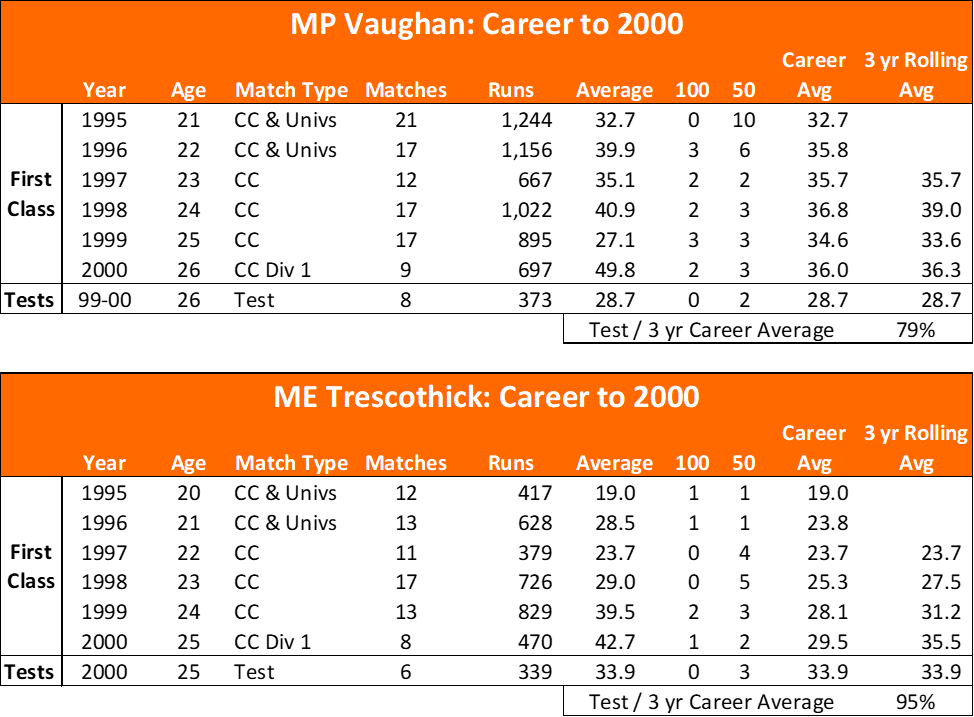
The decision to elevate them to Test level in 1999 (Vaughan) and 2000 (Trescothick), should be judged on what they delivered by the end of 2000**. Between them they delivered 712 runs at 31***. That’s at the lower end of an acceptable average for a top order batsman, albeit two runs per wicket better than expected. If the “Art” camp would like to claim credit for left-field selections, I’m willing to give them credit for two runs per wicket.
Fig 3 – Vaughan and Trescothick 1995-2000 batting data. First year in Tests barely better than county data predicted. Limited to County Championship matches where possible (1995 and 1996 were the early days of the internet, so I could only find First Class information)
Discussion
Career averages are misleading: Trescothick played County Cricket aged 20; his career average was dented by playing while so young.
A better method is to use last three years’ average**** and adjust for age and the level they played at to give an expected Test average.
Conclusion
Vaughan and Trescothick had modest career records before their Test debuts. But there was plenty to indicate they had become some of the best English batsmen by the time they were selected (three year domestic averages of 36), and that if they followed normal career trajectories they could thrive in Tests.
The Test career starts of Vaughan and Trescothick were entirely predictable- no hunches necessary.
Further Reading
Here’s the excellent Vic Marks discussing Vaughan and
Trescothick’s records at the time. Gives a bit more context around other
factors behind their selection (England U19 and ODI performances): https://www.theguardian.com/sport/2000/jul/30/cricket
*Google is full of classic examples of Modest Records. I like this one because it features one protagonist describing the other: Michael Vaughan, 2014: We have picked players in the past with poor county records, such as Marcus Trescothick, and they have thrived on the international stage.
** They averaged 52 and 41 in domestic Cricket in 2001, so my
contention is that they would definitely have been ready by late summer 2001.
*** I’m keen not to be accused of cherry picking the data. By
the end of 2000 they only had 23 completed innings between them. Extend the
analysis to the end of 2001 and they averaged 36 after 32 Matches.
The other factor to ensure I’ve not rigged this is to note who
they played against and where. Vaughan had four tricky Tests away in South
Africa, then four easier games hosting the West Indies. England went undefeated
in Trescothick’s six Tests against West Indies/Pakistan. Three were at home,
three away.
**** Three year rolling average is a bit simplistic. An even
better methodology would be to weight towards more recent innings. That’s a “nice-to-have”.
Three year rolling average is good enough for our purposes.
For the third Test I’d like to see Dominic Sibley open the
batting. To subscribe to this line of reasoning, you’ll need to be persuaded of
two things: firstly, it is not necessary to gain experience in “lesser” Test
series to ensure peak performance in the Ashes. Secondly, that Sibley is one of
the two best opening batsmen England have available.
Opening Up
There’s a school of thought that new players need to be “blooded”
to succeed without first playing against weaker teams in the Test format. The
data indicates that this is a fallacy.
The 96 openers to make their debut since 2005 scored at an
average of 32. That is poor when compared to the average for all openers (36).
However, that’s not the right comparative. Weaker players will play fewer Tests,
so debutants are of lower ability than the average Test player.
A better way of assessing openers on debut is to compare
performance with that player’s career average, adjusted for whether the debut
was at home or away. Looking at it that way, players on debut scored three runs
more per match than expected.
Why should openers do well on debut?
This is unexpected – often players will debut before their
peak, their average will improve as they get better with age. It’s possible
that openers are not thrown in at such a young age as middle order batsmen
(because it’s a specialist position and no one wants to be 0-1).
Another option is that batsmen had an advantage when the
bowler has to played against them before, and is yet to develop a plan. This
may have been the case last decade, but is unlikely in modern cricket.
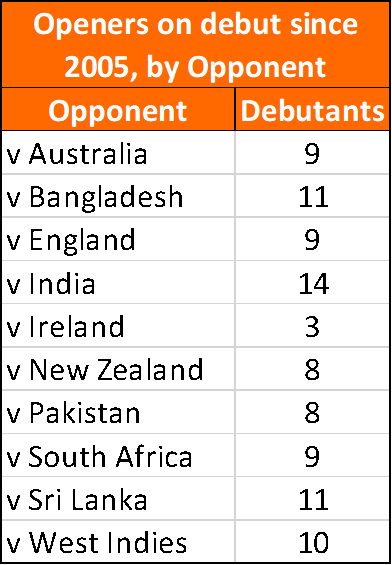
Note that debuts were evenly spread across opponents- it’s
not like selectors wait for the weaker opponents before trying new players.
Sibley the Best?
Before the summer, I rated Dominic Sibley as a decent opening
batsmen, impressive for a 23 year old, but some way short of Test standard. His
expected 2019 First Class average (based on Championship and 2nd XI
matches from 2016-18) was 36. That made him at best seventh on the list of possible
Test openers. For fans of lists, Burns (51), Stoneman (44), Jennings (42), Mitchell
(40), Hales (39) were ahead of him on merit, and Hameed (expected average 36)
was also ahead because of his fame.
Fast forward to August 2019. Reflecting Sibley’s spring/summer
return of 940 runs in my ratings, his expected Division 1 average jumps to 42.
Tied for second place with Stoneman.
Adjusting for age, Sibley would expect to average 34 in
Tests.
If one limits the search to red ball cricketers, there could
be few complaints with Sibley opening the batting for England.
However, there’s this Roy chap. Top ODI player- averages 43.
Can he make it as a Test opener? Leaving his white ball record to one side
(because I’ve not looked at the predictive power of white ball results on red
ball expectations), in First Class Cricket he averages 38. He has performed
better recently: averaging 43 in Division 1 over the last three seasons.
However, in those three-and-a-half-seasons he barely played: 32 completed Test/Championship/2nd
XI innings while Sibley has 73. Roy didn’t open in either of his games last
year.
Conclusion
Don’t be afraid to give an opener a debut if their record
says they are capable.
A reasonable scenario is that Denly (expected Test average 31) picks up 60-80 runs over the course of the Lord’s Test this week, and is dropped on the back of averaging 24 after ten innings.
Ambivalence: having two opposing feelings at the same time, or being uncertain about how you feel.
Cambridge Dictionary (Cambridge University Press)
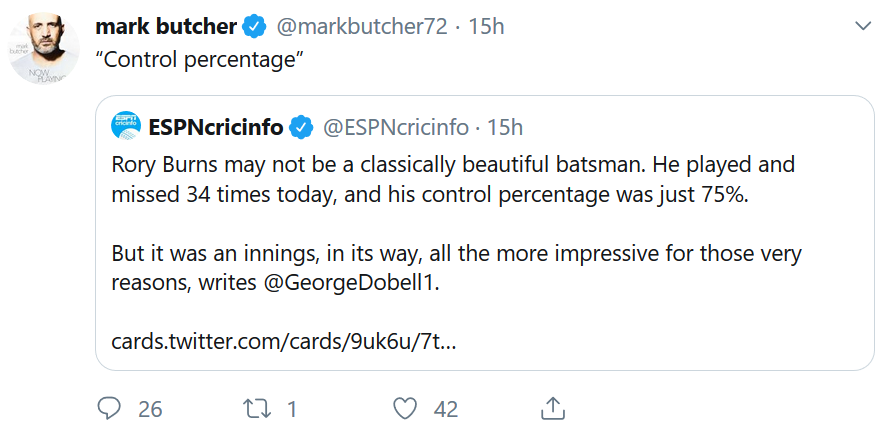
Yesterday (2nd August 2019) Rory Burns scored his first Test century. It was a struggle. It was error strewn. But he got there. In the evening the twitter consensus was that the important thing was that he did it, not how he did it.
Fig 1 – Twitter Screenshot.
What didn’t I like about Butcher’s point*? I’ve always thought
that you can learn more from a lucky long innings than a duck. Someone gives a
chance first ball, gets out – so what? Another player hacks their way to thirty,
regularly playing and missing or chopping the ball past the stumps – well there
you have some useful data – the bowler is dominating the batsman with a decent
sample size.
But a hundred? I’m conflicted. You can’t use a hundred as
evidence that a player is no good. Can you?
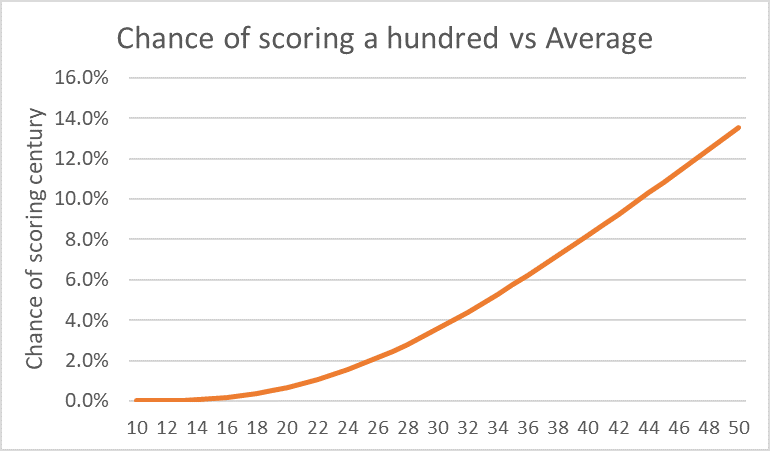
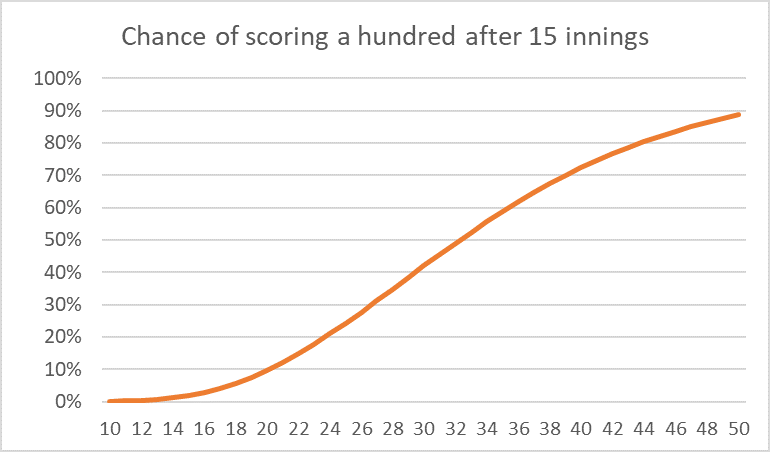
You are surprisingly unlikely to get more than a hundred
if you average under 25
Fig 2 – Theoretical Probability of scoring a century in a single innings vs average.Fig 3 – Theoretical Probability of scoring at least one century over fifteen innings
Over his first seven Tests, Burns averaged 22. A batsman with that ability only has a 1% chance of getting a hundred in any innings. Does that mean that Burns was lucky? That depends what you believe: either he is a twenty-something averaging batsman who had some fortune, or a thirty-something averaging player who is performing as expected. County data says he’s the latter.
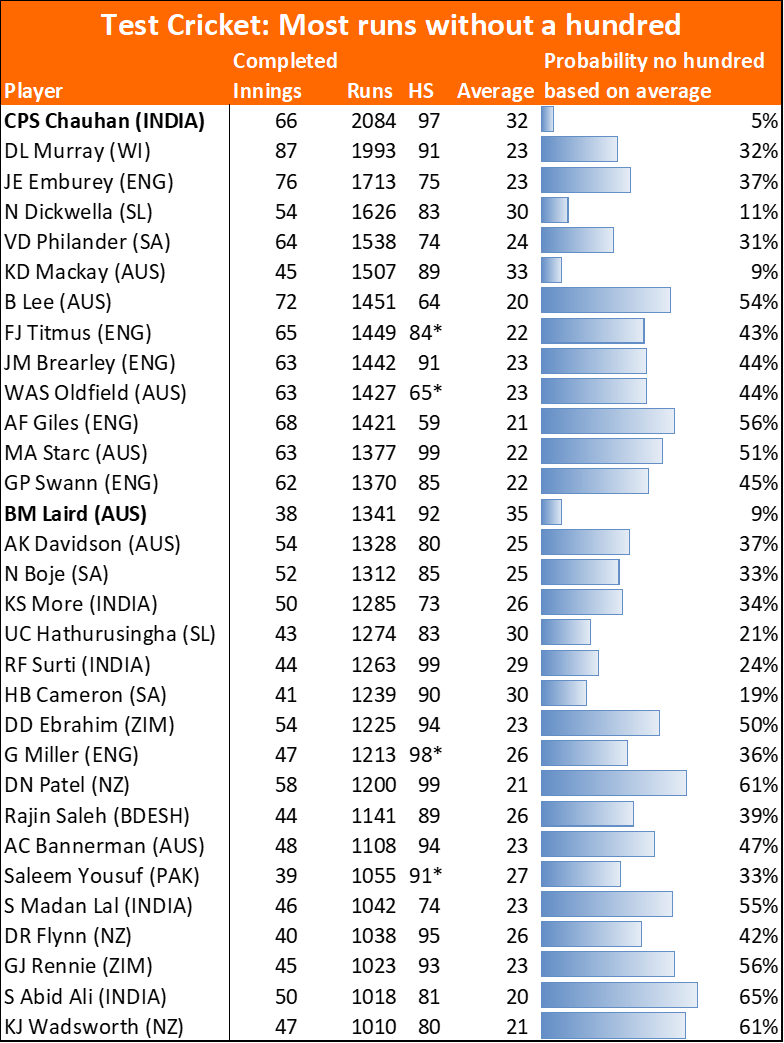
One can get lots of runs at a decent average without a
hundred.
In the appendix I’ve listed the top run scorers in Test Cricket who didn’t get a century. Was Chetan Chauhan any less of a batsman because he scored 2,000 runs averaging 32 but never made more than 97? No, the data says there’s a 5% probability that it was just chance that meant he didn’t get a hundred, with no psychological flaws or lack of stamina at play.
That’s all lovely – but DO HUNDREDS MATTER?
Joe Root’s hundreds don’t matter. He has played a lot of
innings, so his average is the one metric you need. 49.03.
Rory Burns’ hundred doesn’t matter to me (other than to say there’s no reason to over-rule my analysis– expect him to average 39 over the long term in Test Cricket). Burns scoring a century matters only if Test scores are all you use to appraise batsmen. You would rate him significantly more highly after scoring a hundred than before (though, knowing it was an ugly hundred, you would probably rank his expected average somewhere from 25-35).
One example where I think hundreds matter is when there’s very little to go on. Dan Douthwaite scored a hundred against Sussex when playing for Cardiff University. As he wasn’t on my radar at that point, that 100* meant that I could safely assume he would average more than 25 in Division 2.
I’m thus ambivalent about rating players based on scoring hundreds: most of the time I’ll take averages over hundreds. When there’s noting else to go on, a big score can tell you that someone’s not bad.
Appendix:
Fig 4 – Test records of batsmen with no hundreds. Final column shows the probability of a player with that average not scoring a hundred in the number of innings they played.
*I should add that Control Percentage isn’t a metric I value as highly as False Shot Percentage. To my embarrassment, I’ll admit I misread Butcher’s original tweet as criticising False Shot Percentages. Still, serendipity – if I could read, I’d never have worked out whether I care about hundreds.