The last blog post looked at the expected average for a tenth wicket partnership, and here I’m going to examine some strategies to yield better results in the final leg of the innings.
Long-term number eleven batsmen (James Anderson, Makhaya Ntini and Trent Boult) have played enough innings that we can use their successes and failures to determine: what should the last pair do to maximise runs?
There are three main factors to be considered: proportion of balls faced by the number eleven, strike Rate for the number eleven, and strike rate for the senior batsman.
As flagged by Chrisps in the comments last week, we’d ideally also consider bowling and fielding strategies for each batsman, but sadly these aren’t publicly available.
STRATEGY 1: Manage the balls faced by the number eleven (take the single on the fourth ball of the over)
A number eleven gets out around every 20.8 balls. If they face a full over, there is a 26% chance they’ll be dismissed. That means the batting team should do whatever they can to keep the number eleven off strike, right?
Yes and no. During Anderson, Ntini and Boult’s most fruitful partnerships, they faced an average 45% of the strike.

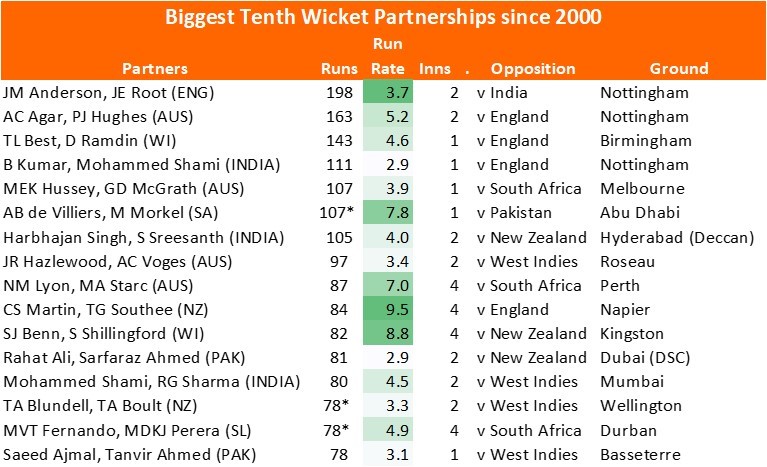
When Root and Anderson put on 198 against India in 2014, Root was carefully managing the strike: Anderson only faced the first ball of the over seven times in 53 overs. He faced the last ball of the over 42 times out of 53. So there’s a contradiction – the number eleven is being protected, and yet facing nearly half the deliveries. What’s going on?
The answer lies in the way Root protected Anderson: taking a single 20 times on the fourth ball of the over. By looking for a single on the fourth ball of the over, there were two further chances to rotate strike that over if Root didn’t find a gap. This gave Anderson just 41% of the strike, and crucially only three risky overs where Anderson had to face all six balls.
If the fielding side counter this strategy by defending the single for the last three balls of every over, there should be plenty of boundary opportunities for the senior batsman.
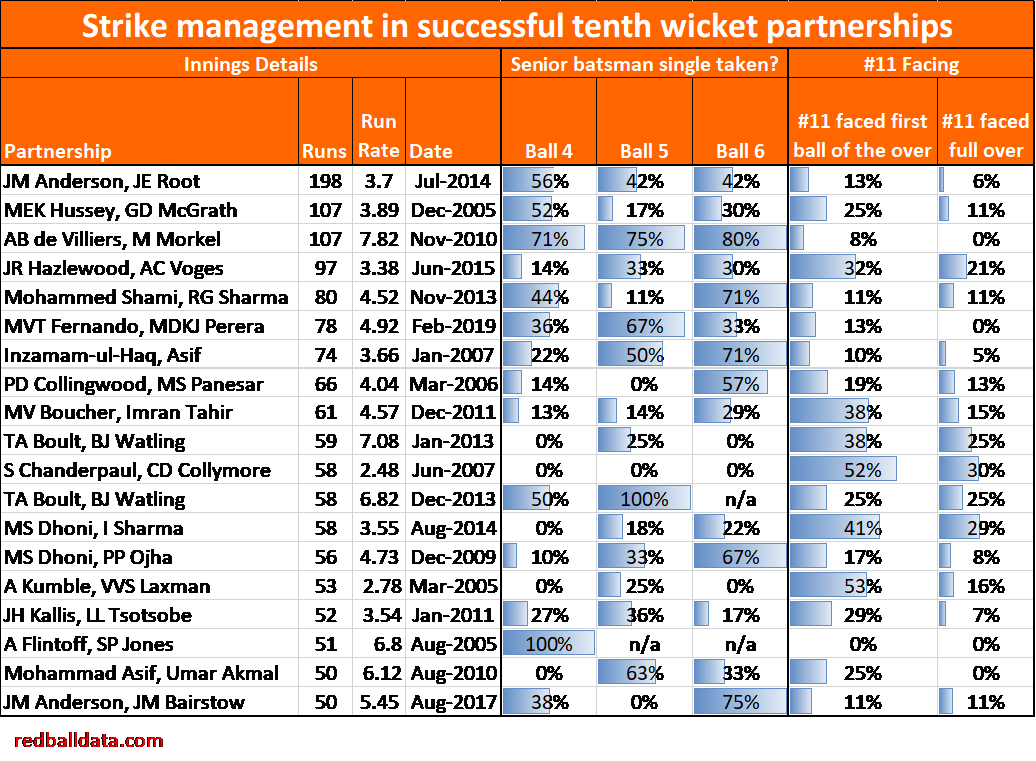
The data shows three viable options: take the single from the fourth ball onwards (eg. Root), gamble and go ballistic (Watling) or trust a naturally defensive number eleven to block out an over (Collymore and Sharma).
STRATEGY 2: Keep usual strike rate for the number eleven (three runs per over or more)
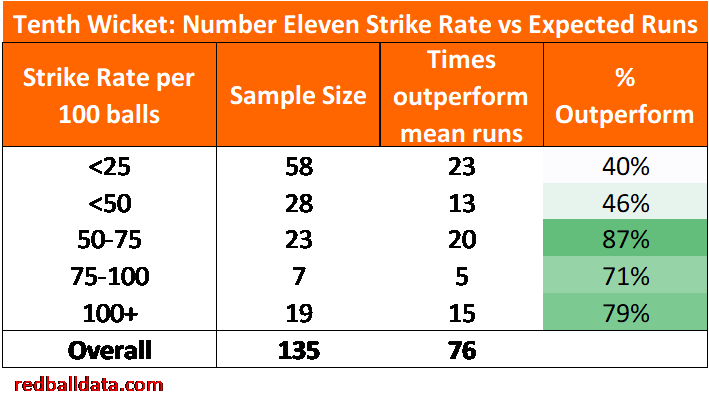
Well there’s a surprise – the hypothesis was that the number eleven should defend, protecting his wicket while the senior batsman scored the runs. The converse is true: batting normally or counter attacking is the key to success. This may be because batting normally allows the number eleven to get off strike, and means a balanced field rather than an attacking one (think square leg, mid-on, cover rather than three more catchers).
STRATEGY 3: The aggressive senior batsman.
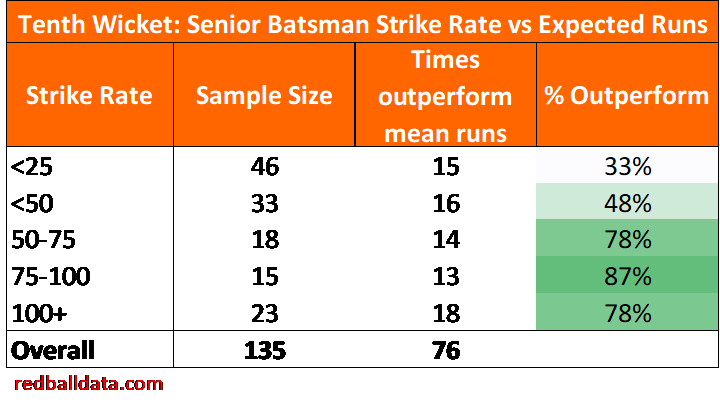
Not too much to say here, just that attacking batting is good. It’s hard to accrue a big last wicket partnership at three an over unless the number eleven can be trusted to soak up a lot of deliveries.
Conclusion – for best tenth wicket results, the number eleven should bat positively but normally. Meanwhile the senior batsman should play aggressively on the first three balls of each over, before looking to take a single from the fourth ball onwards. Only expose a number eleven to a full over if you want a nice not-out to boost your average!
A quick word on methodology – the sampled innings for Figures 1, 3 and 4 only include those where runs were scored, and where the senior batsman played more than 30 innings in their career. The Strike Rates exclude the delivery where the wicket fell – otherwise shorter innings would be disproportionately affected by the wicket ball in which no runs are scored. The “% outperform” metric is how often the runs scored exceeded the mean expected runs for that duo for a given innings, taking into account whether they are at home or away.