
Clive (@vanillawallah) was looking at Kohli’s scores in ODIs since the last World Cup, suggesting that:
- Kohli is consistent
- He succeeds more than he failures
To check this, I compared Kohli’s performances against what my model would expect him to do – Kohli’s run ranges are broadly in line with what you would expect given his average. His consistency is a consequence of his ability, rather than a specific trait of his batting.
I modelled 1,000 innings for Kohli batting at 3 for India, with an assumed average of 95 (his average over the last 54 games / 3 ½ years).
The results show slightly more single figure scores in the real world vs model, offsetting slightly fewer scores in the teens. This is likely due to small sample sizes.
Two interesting observations:
- In a quarter of innings he would (and did) score a hundred. Phenomenal.
- The run distribution is skewed towards the 30-50 range by Kohli running out of time – caused by India successfully chasing down targets and the match ending while he is mid-innings.

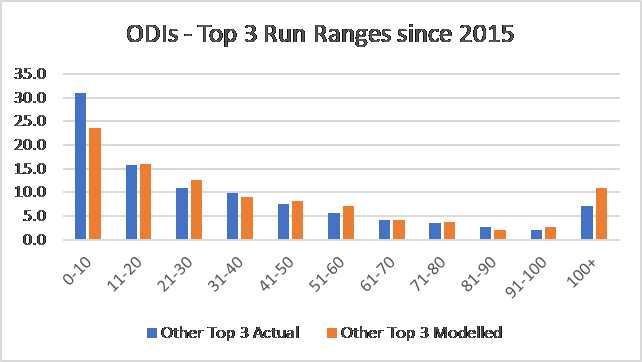
Rest of the Top 3
Clive also pulled in data on all other top 3 ODI batsmen since the last World Cup. This is a much larger sample size- and worth checking the distribution as a way of verifying my modelling.
Simulating 1,000 innings with two openers: one of whom averages 35, one of whom averages 45 reasonably reflects the real world distribution of scores that Clive showed.
Two exceptions:
– The real world having more low scores (probably from the times when weaker openers have been selected)
– More hundreds modelled than seen.
P.S. Appreciate this is White Ball ODI Cricket rather than Red Ball Data. Don’t tell the Branding Police.
