Revisiting predictions for West Indies vs England, 2019.

Putting predictions on this blog allows testing of prediction against results. In this post I’ll look back at what I said before England’s tour of the West Indies in 2019.

I was surprised how few concrete predictions were included in previous posts. Next series I may include player by player predictions, so there are more data points.

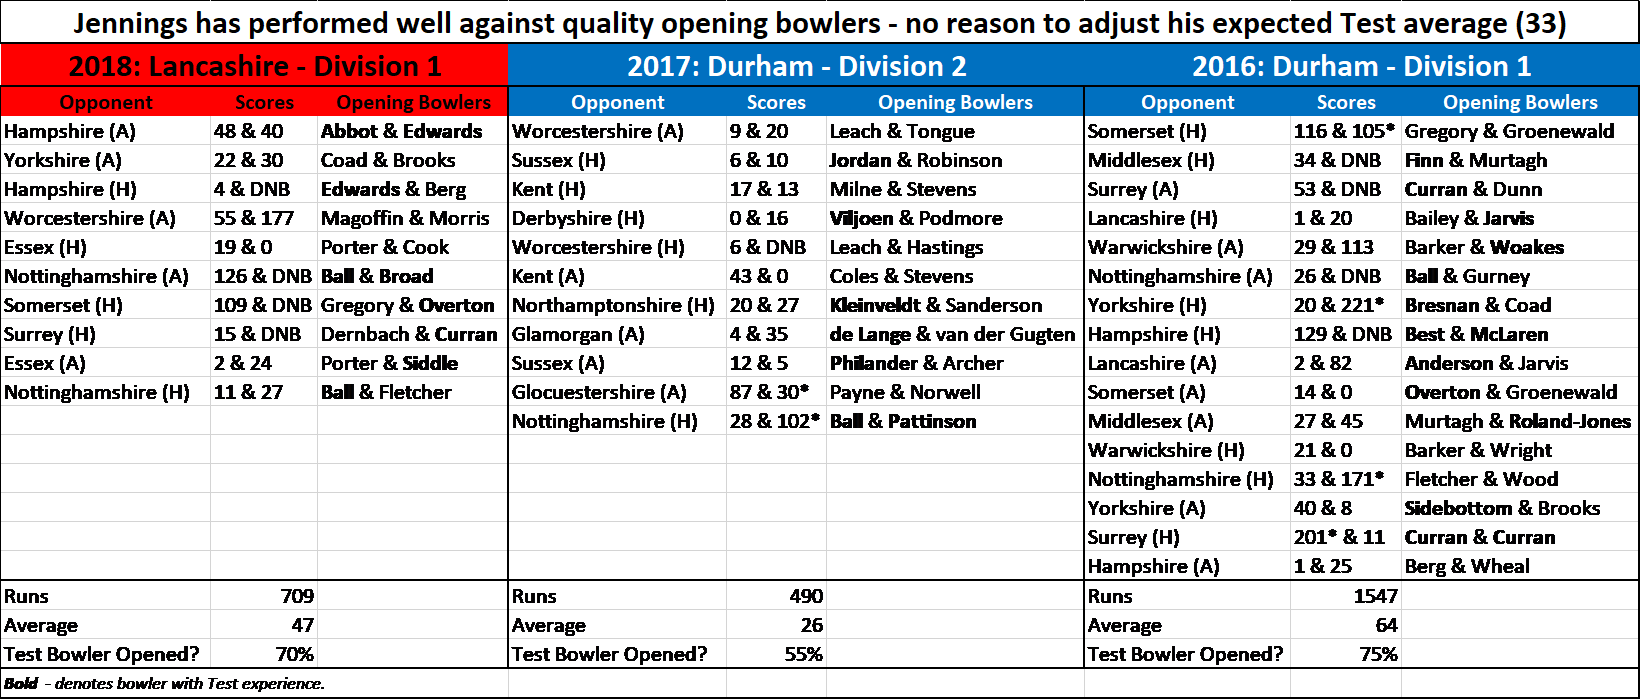
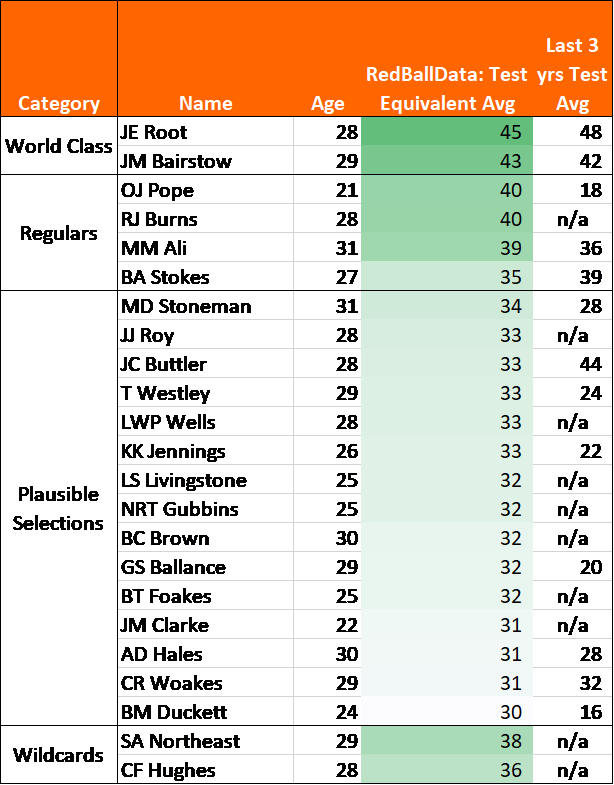
1.No reason to model Jennings’ expected Test average as anything other than 33. 

❌ Jennings averaged 16. Though it was only four innings, it’s hard to see that prediction as a success! The extra data takes his expected average down to 32.

2. One spinner is the right choice

✅ Rashid’s match figures of 26-1-117-0 with the ball and 12 & 1 with the bat showed England the error of their ways.

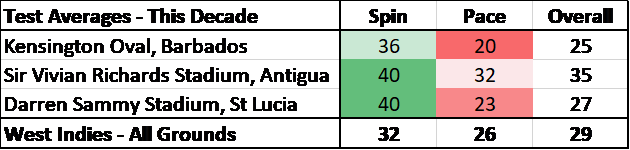
3. History says expected average by bowing type Spin 32 Pace 26

✅ Actual averages: spin 35 pace 21, which reflects the quality of bowing on display – both teams have better quicks than spinners.

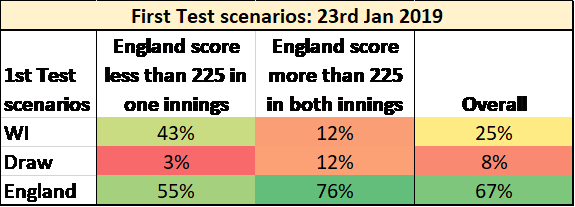
4. West Indies’ best chance will come if their fast bowlers can keep England under 225 in one innings

✅ Both West Indies victories included innings where England scored under 225. England won the third Test scoring 277 & 361-5. I don’t really like this kind of prediction though: Cricket is won by taking 20 wickets and scoring more runs than your opponent. How you do that is unimportant.

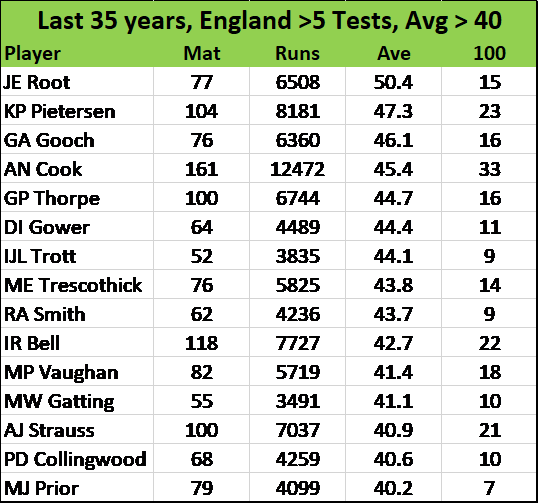
5. England 2019 are at about the level of the 2005 Ashes side, by having no weak links rather than being packed with world-beating batsmen.

❓Most would say that England’s batting was stronger in the past, but the current team has huge potential. My view is that England’s current batting is fragile because it is not that good, while some pundits would have you believe that England are afflicted by “amazing-but-collapse-too-often syndrome”.

6. England have a one in three chance of Whitewashing the West Indies.

⚠️ I stand by this prediction- though hard to appraise the success of this. Just because it didn’t happen doesn’t mean there wasn’t a 33% chance of it. Equally if it did happen that wouldn’t tell us much from one prediction.

I’ll make more testable predictions next series.

Should Jennings’ expected average be reduced after the Bridgetown Test?

There has recently been interest in Keaton Jennings’ average against pace. Two failures in Barbados have stoked this discussion. His average (26) in 16 Tests is below his expected average (33) based on County performances over the last three years. Generally, I would choose the big sample size (County Cricket) over the smaller sample size (Tests), and so rate his expected average at 33, not 26.

But – can we learn anything about technical flaws from Jennings’ Test performances to change that view? Specifically his average against pace:

Keaton Jenningsaverage against pace (16.90) is the lowest of any opener to have played more than 15 Tests, for games in which ball-by-ball data is available.

Wisden (Jan 26th 2019, via Twitter)

I’ve had a look at his performances over the last 3 years on the county circuit. The hypothesis is that there are some very good pace bowlers in County Cricket, and as an opener Jennings will face them (a middle order batsman might be able to make hay without facing much of the best bowlers).

The data supports this hypothesis – 68% of the time he faces at least one opening bowler with Test experience.

Keaton Jennings has played two of the last three seasons in Division 1, scoring 11 hundreds, and making runs in a variety of conditions (including April and September- when the deck is stacked in the bowler’s favour). His three year average isn’t amazing, but the key point is that one can’t look at the above data and conclude that Jennings has a problem against pace bowling.

As an aside, this piece is a reminder that I need to build a way to combine the Test performances to the First Class performances to ensure I’m using every available data point in appraising batsmen.

Conclusion: There is no reason to model Jennings’ expected Test average as anything other than 33. Plenty of people will disagree with that!

West Indies vs England: Preview

West Indies can beat England against the odds, but they’ll need their pace bowlers to perform.

****

The blueprint – Bridgetown 2015. 1-0 down in the series, with a first innings deficit of 68, the West Indies were about to be batted out of the Test. Hearing a wicket fall, a reveller in the Party Stand asked “Was that Trott or Cook?” and was baffled to learn that it was in fact Root, and England were 28-4. The new ball had done the damage, and by the time 20 overs had been bowled it was 39-5 and the game was back in the balance.

West Indies were eventually set 192. Darren Bravo marshalled the batsmen to the target with five wickets in hand. The hosts had accrued only three scores over 30 in the Test, but somehow pulled off an unlikely victory, and drawn the series 1-1.

****

With that surprise firmly in mind, let’s make some informed predictions for the upcoming series.

1) One spinner is the right choice. This decade the average is 32 for spinners, 26 for pace bowlers. It may be that pitches are turning more than they used to, and it’s true that spinners get 37% of wickets in the Caribbean, but this turn hasn’t delivered cheaper wickets. That said, if a team can reliably judge a pitch as more spin friendly than the average West Indian pitch, then they should go with two spinners – selectors just need to be sure there will be more in the pitch for spinners than quicks before making that decision.

2) West Indies’ best chance will come if their fast bowlers can keep England under 225 in one innings. Turning pitches or not, the West Indies have no elite spinners. If they are going to win this series it will be through devastating fast bowling.

They are unlikely to amass buckets of runs – so Holder’s bowling unit needs to neutralise England’s batting. Specifically, if England score fewer than 225 in one innings, that sets up a target within the range of the West Indian batting.

****

Taking all factors into account, modelling suggests the probabilities for the first test are: 24% WI. 7% Draw. 69% Eng.

That translates to a one-in-three chance of England managing back to back whitewashes away from home. The last time England achieved that? 1889.

West Indies will probably lose: their batting and spin bowling is inferior to England’s. But if we’ve learned anything from the 2015 series, it’s that home advantage is real, and the new ball could do some serious damage, leaving mystified England supporters to ask “was that Burns or Jennings?” as Stokes returns to the pavilion.

35 is the new (and old) 40

Managers tend to pick a strategy that is the least likely to fail, rather then to pick a strategy that is most efficient. The pain of looking bad is worse than the gain of making the best move.

Moneyball (2003)

In the last 35 years England have had just 15 batsmen who averaged more than 40 over their career. Expectations should shift: aspire to players averaging 40; accept batsmen averaging 35.

The chart below may surprise you – it surprised me. How could barely any recent English batsman reach the benchmark set for them? Averaging 40 (at least in my head) was a minimum, not an elite average.

The data speaks for itself- 45 isn’t the new 40. 35 is the benchmark, and has been for a long time.

We, the red ball loving hordes (and our journalist generals) need to help the selectors by having realistic expectations.

The selectors should return the favour: stick with players that are good enough, even if they aren’t stars, and even if pundits are piling on the pressure.

Next time someone is 10 tests into their career, averaging 34 and with the data saying they would average 35 long term, let’s not call for a change because they aren’t scoring enough. Only remove them if a better prospect comes along – not someone with similar numbers who we might want to gamble on.

There’s a great case study: Andrew Strauss retired in 2012, and received wisdom is that he is yet to be replaced as an opener. We wanted the next Strauss. We should have been looking for the next Rob Key (15 tests averaging 31 between 2003-2005 while we waited for the next star batsman to come along).

Instead Cook was partnered by Compton (average 31) – Root (42) – Carberry (28) – Robson (31) – Trott (12) – Lyth (20) – Ali (14) – Hales (27) – Duckett (23) – Hameed (32) – Jennings (27) – Stoneman (28) – Jennings

Remember who Carberry got his runs against? An away Ashes series in 2013: Harris, Johnson, Siddle, Lyon, Watson. Those 281 runs were well earned.

With hindsight, pretty much every pick between Robson and Jennings was an error. England had viable alternatives for Strauss 3 times: Compton, Carberry and Robson. Having rejected them, playing people out of position (Trott / Ali) and gambling on youth (Duckett / Hameed) as the next cabs off the rank as England moved ever further down the list of possibles.

England chose weaker options because they weren’t willing to settle for a batsman averaging in the low-30s. That cost England runs- and since the selectors’ are employed to pick the best team possible, this is a failure. One they don’t get criticised enough for. Fear not, dear reader, we know England’s best batting options– and will collectively tut if the selectors deviate from them!

Conclusion: England should hold their nerve, even if Burns and Jennings are only averaging 33 coming into the Ashes.

A review of England’s batting options

Eeny meeny miny moe

Anon, Pre-1820

Whinging about selection is part of how I traditionally spend the days leading up to an England Test. It’s my habit, and I’m probably not alone in that.

With the new(ish) England selection panel of Ed Smith, Trevor Bayliss, and James Taylor, whinging about batting selection has been more difficult.

Burns in for Cook? The logical choice. Moeen Ali recalled? Makes sense. Buttler plucked from White Ball obscurity? Not what I would have done (Hildreth or Livingstone), but OK.

Looking for some whinging ammunition ahead of England’s first warm up game against a West Indies Board XI on 15th Jan*, I did some analysis of England qualified batsmen. Specifically, their records in the last 3 years of all Red Ball Cricket (Test to 2nd XI, adjusted for difficulty).

What I expected to see was a clear hierarchy of players, with some of my favourites at the top, and England’s sub-optimal picks somewhere down the list. Actually, the selectors’ choices are supported by the data, and England have a big group of players who are of very similar abilities.

Below I’ve grouped players by expected Test average, based on the last 3 years:

World Class (Expected Average 42+) – Root & Bairstow

Test Regulars (Expected Average 35-42) – Pope, Burns, Ali, Stokes

Plausible Selections (Expected Average 30-35) – Stoneman, Roy, Buttler, Westley, Wells, Jennings, Livingstone, Gubbins, Brown, Ballance, Foakes, Clarke, Hales, Denly, Woakes, Duckett.

Wildcards (Data says Expected Average >30, but reasons to be suspicious)– Northeast: mostly driven by 2016 scores in Division 2. A poor run at Hampshire lately. Hughes: scored 425-3 in 2nd XI last 3 years. Didn’t play a first class game in 2018, only made 209 runs at 23 in the 2018 North Staffs Premier League, so probably safe to rule him out of Ashes contention.

Conclusion:

From a batting perspective, England have chosen well. They’ve picked all the World Class and Regular players (apart from Pope, who only has 32 completed innings, and is on the fringes of the squad). All their other batsmen are from the Plausible Selections bucket. England have a lot of Plausible Selections; it doesn’t really matter which of them they pick. Dropping Buttler for Hales would be worth about 4 runs over the course of a Test. As long as the selectors keep picking players that are amongst the best available, I’ll cut them some slack.

Other Discoveries:

  • England’s batting is weaker than at the start of the decade. England were spoiled by a team with 7 batsmen who averaged over 40 – like this side that beat South Africa by an innings in Durban in 2009. Pragmatically, they use 2 or 3 all-rounders (Stokes, Ali, Woakes) and often use 8 batsmen to do the job that 7 did at the start of the decade.
  • A number of players have been tried that currently average under 30 in Tests: Stoneman, Westley, Jennings, Duckett, Hales, Pope. This analysis indicates that these were good selections, and much of the underperformance is due to chance. An example: Stoneman averaged 28 in 11 tests, against an expectation of 34. But 11 tests is a small sample size, and 7 of those tests were away, including an Ashes series.
  • Bairstow is one of England’s two best batsmen. Dropping him would be an error.

*England’s Squad to tour the West Indies (Batsmen only):

Joe Root (Yorkshire) (captain), Moeen Ali (Worcestershire), Jonny Bairstow (Yorkshire), Rory Burns (Surrey), Jos Buttler (Lancashire), Joe Denly (Kent), Ben Foakes (Surrey), Keaton Jennings (Lancashire), Ben Stokes (Durham), Chris Woakes (Warwickshire)