Getting your eye in across formats

As ever shorter forms of Cricket proliferate, fast starters with the bat are becoming more valuable (just ask Dane Vilas). Let’s take stock of how players start across the three formats.

Tests, ODIs, and 20-20 are essentially the same game. Each match starts on a fresh pitch, with different ball, bowlers and climatic conditions to the last game. It takes more than one over to get one’s eye in, so batsmen are simultaneously settling in against multiple bowlers no matter the flavour of Cricket they are playing. The key differences which might impact how batsmen settle in are the white ball deviating less than the red ball, and the intent of batsmen differing.

How do we measure how settled a batsman is in each format in a given stage of the innings? In Tests we can use a batsman’s average ball-by-ball. However, in white ball Cricket Strike Rate is the prize (a cynic might suggest the curves suit my story so I’ve cherry picked).

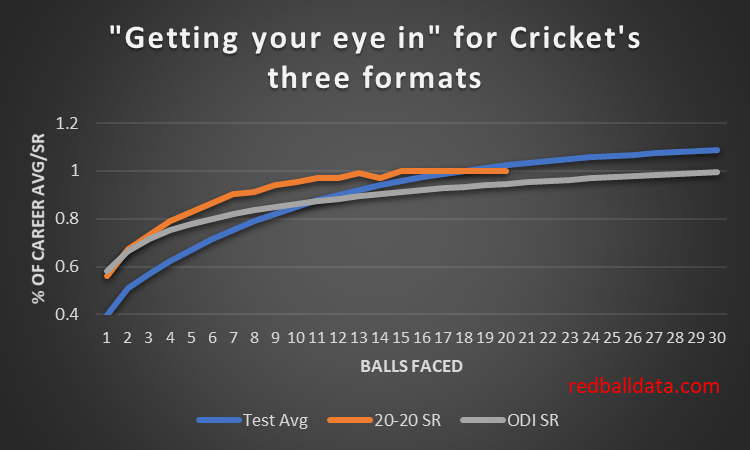
The first thing to note is that these curves are quite similar – 20-20 batsmen really do take time to go through the gears. I’ll wager the slow acceleration is not through lack of effort. Players will be going as fast as they think they can: accelerating faster risks their wicket.

Data sources

Normally, this site is based on numbers I’ve crunched. This piece is an exception – while the ODI analysis is my own, I’ve based the 20-20 curve on this piece from sportdw.com. An aside – I looked at this back in 2017, and the bookmakers weren’t getting their “what happens next ball” odds right. Wish I’d been in a position to capitalise, but with a young family such activity was very much on the back burner. Anyway, it’s a fine post from sportdw.com, so take a look.

For Test matches I’ve used the analysis mentioned in my last post, Bayesian survival analysis of batsmen in Test Cricket. I had to make some assumptions to take Stevenson & Brewer’s player specific data and create a general case. Any errors in that process are mine – if you’d like to know about “getting your eye in” for Test Cricket, please read their work.

The current state

Let’s think about this behaviour from a theoretical perspective: in any innings a team are looking to make the best use of their resources. In Tests that’s as simple as maximising runs per innings: pick players that score the most runs per wicket, regardless of whether they start badly then get good, or quickly settle but then don’t improve much. Appraising Test players is easy – just look at the average*!

ODIs and 20-20s need to manage two scarce resources: wickets and balls. In 20-20 the number of overs is more of a constraint than in one day Cricket, which is to the advantage of faster starters. After 12 balls a 20-20 batsman is at full speed, while an ODI player is only scoring at 90% of their career SR.

What happens next

Data on 20-20 is everywhere. That’s partly why I don’t focus on it: the people that analyse 20-20 for a living are doing a great job. Seeing what’s available publicly, I can only imagine what depth of analysis the richest franchises have locked away on their laptops! I would be very surprised if there aren’t “getting your eye in” curves for each batsman, and teams optimising batting orders to get the fast starters into the right roles, alongside the high-average-slow-start-but-quick-when-they-get-going types.

Personally, I like a blunt approach – and assume all players play themselves in in the same way. Partly this is because I lack data – so have to make assumptions else I’d never have a model. Ultra short form games derived from Cricket will test that approach, and we will learn more about Cricket over the next couple of years.

Comparison with baseball

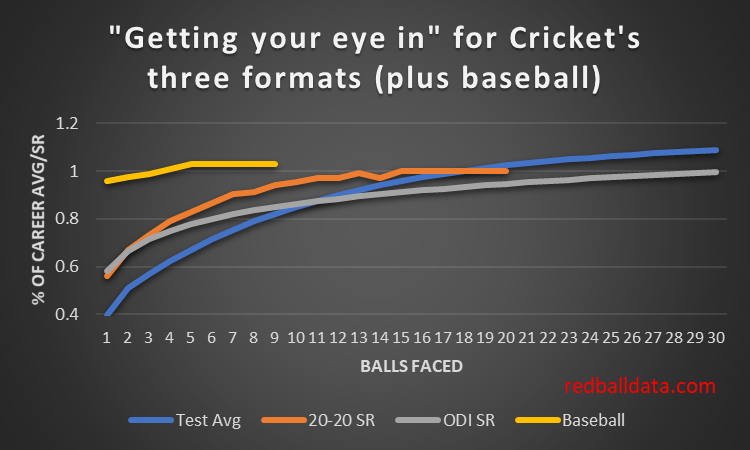
Baseball is a little like Cricket. Yet batters are up and running after just a handful of pitches. Why? A combination of there being only one pitcher, the ball not bouncing (so the ground matters less), and long breaks between innings mean that there’s limited benefit from repeated plate appearances in a game. Adding the yellow line for baseball shows just how similar the curves for Cricket’s three formats are. For now.

*For consistency I should say “factor in how many innings they have played, whether they were home or away, their record in each competitor adjusted for difficulty, what number they were batting, the grounds they were playing on, how old they are, which attacks they played against, what innings of the match each innings was” – but my writing barely flows at the best of times; that detour would not have been helpful. Hopefully you know what I meant.

Is middle order batting easier than opening?

I have a theory that openers are better than middle order batsmen with the same average. If someone averages 35 against the new ball, that has to be better than averaging 35 against the third change bowler using a 60 over old lump of leather.

Here’s Michael Carberry’s take on the unique challenges of opening:

As openers, we don’t have the luxury of being able to come in against the old ball where it’s doing less. You see it on the first morning of a match. Everyone’s prodding the wicket. ‘Oh yeah, this looks a belter’. It’s never a belter when you’re facing the new ball. If the ball is going to do something, generally you’re the one who’s going to get it.

If Carberry is right, once openers see off the new ball, their expected runs for the rest of the innings should be higher than their career average – they’ve done the hard part.

How to prove it though? The proper way would be to show what various batsmen average at differing stages of their innings, against particular bowlers, against both old and new ball, and when the bowler is in their first, second, third spells. That’s not complicated, but would be time consuming, starting from a ball by ball database of Test Cricket. I haven’t done that. Instead, I’ve looked at what happens to a batsman’s average once they are “in”. Previous analysis tells me a batsman is fully in by the time they are 30 not out.

Fig 1 – difference between Runs scored and Expected Innings Average once a batsman has got to 30 runs. This is the boost to someone’s average once they have “got their eye in”. Split by batting position. Expected Average is career average, adjusted for home advantage, innings number, ground. Test matches 2005-2019.

Analysis

  1. The benefit from “getting your eye in” is worth about five runs onto a player’s average (ie. if you average 40, by the time you get to 30* your expected average goes up to 45).
  2. Surprisingly, openers don’t get a further boost once they get to 30. This is odd – by the time an opener is on 30, 20 overs would have gone, the three best bowlers would have bowled six or seven overs and the ball would no longer be hooping round corners. I’ve definitely watched England play, rocking back and forth in my seat saying “if they can just get to 20 overs, see off the new ball, it will get easier. It’ll be all right”. Turns out that was piffle. It gets easier (c.12%), but it’s not a violent swing into the batsman’s favour.
  3. Weaker middle order batsmen get the biggest benefit from getting to 30. I think that’s because they really are the easiest times to bat – 40+ overs into the innings, tired bowlers, etc. In other words, these players aren’t becoming relatively better once they are in – they just tend to be building an innings as conditions become more favourable.

Conjecture

Put the above analysis together, and I’ll give you a second hypothesis – collapses in red ball Cricket are partly because lower middle order batsmen’s averages flatter them. A batsman that averages 30 can make hay in helpful conditions – yet they only average 30. That must mean that they average less than 30 in challenging conditions. Maybe when the going gets tough, the middle order will disproportionately get blown away. Unfortunately for me, that hypothesis doesn’t show up in the numbers. Yet.

Methodology

Since “Expected Innings Average” (EIA) is a non-standard metric, it’s worth explaining what it is and how I’ve derived it, else you’d have every reason to dismiss this as someone fitting the data to match their hypothesis.

EIA was calculated for every innings where a batsman scored over 30. Their runs in that innings (minus 30) were compared to their EIA to get a view of how their average (once they had got their eye in) compared to what one would expect from when they started their innings. Thus Benefit from getting eye in = Runs scored – EIA – 30.

To calculate EIA I started with the batsman’s career average. Then adjusted for the runs per wicket on that ground, then added or subtracted 8.5% depending on Home/Away. To adjust for not outs, I added the EIA to the not-out score.

For instance, when Virender Sehwag scored 319, his expected average was 49 (Career Average) * 1.2 (Ground adjustment for Chennai) * 1.17 (Innings Adjustment – for the 2nd innings of the match) * 1.085 (Playing at home) = 74. Conditions were favourable – but he still exceeded expectation by 245.

In case you aren’t a fan of the above, I also calculated the impact based on raw averages. It doesn’t reveal much. Just goes to show how important the context of an innings is: raw averages are just too simplistic.

Fig 2 – difference between Average and Career Average once a batsman has got to 30 runs. Test matches 2005-2019. Note how much more volatile this chart is than Fig 1. Also that (using raw averages only) numbers three and four appear to have a negative impact from getting their eye in!

Further reading

Michael Carberry’s recent interview in Wisden is linked here.

Here’s a proper statistician’s view of the early stages of a batsman’s innings – Bayesian survival analysis of batsmen in Test cricket. Note how low effective averages are when a player is on less than ten. A far more pronounced effect than I had expected.