How does “getting your eye in” differ between Cricket’s formats? One way to measure it is through the proportion of ducks: more ducks implies it’s harder to get started.
An academic paper was brought to my attention recently. The article focused on ranking Test batsmen across eras, though what I got out of it were the ideas stimulated by reading through the full methodology. I added three entries to the “Blog Ideas” note on my phone. The first of these follows.
The academics needed to adjust for the disproportionate number of ducks in Test Cricket relative to a Geometric progression. How disproportionate? Ducks are roughly two-and-a-half times more frequent than theory would suggest. It’s hard to get one’s eye in.
What about the difference between red and white ball duck frequencies?

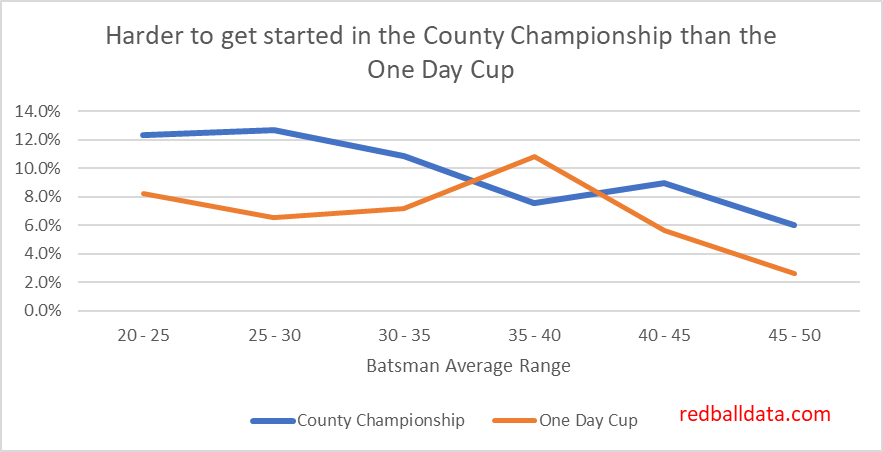
There’s an apparent contradiction here: in limited overs Cricket there is pressure to score from ball one, which should carry more risk – yet it’s easier to get off the mark in ODIs than in Tests. For batsmen averaging 35-40, in ODIs 6.8% of innings are ducks, while for Tests 7.5% of innings are ducks – a 10% greater frequency.
The only explanation I can offer is the defensive mindset of fielding captains in ODIs.
Conclusion: Bring the field in and have more catchers when a batsman is on nought in ODIs. I know it then looks weak to change the field after a couple of balls – but there is a clear opportunity.
Post Script: Opening the batting is easy
It should be harder to get off the mark in difficult conditions.
It should be that openers get out on nought more often than middle order batsman (if they have a similar average). Yet the opposite is true.
Here’s the chart:
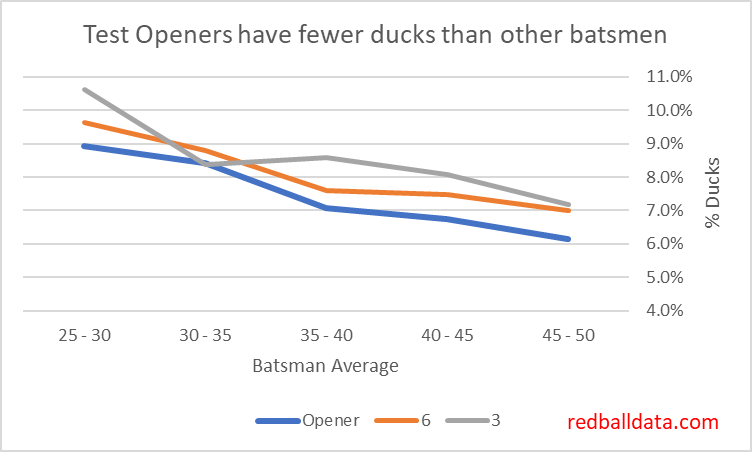
I think this is because openers face very attacking fields, with lots of slips, so any bat on ball should find a gap (as long as you aren’t out caught!)
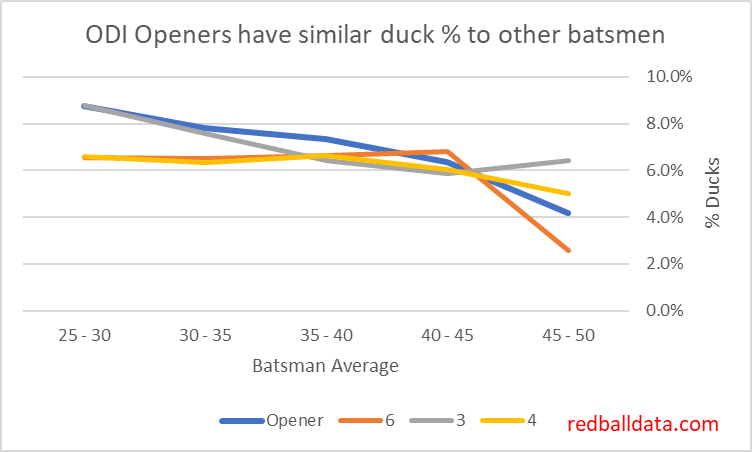
Comparing this to ODIs gives a sense of how openers stand out in Tests